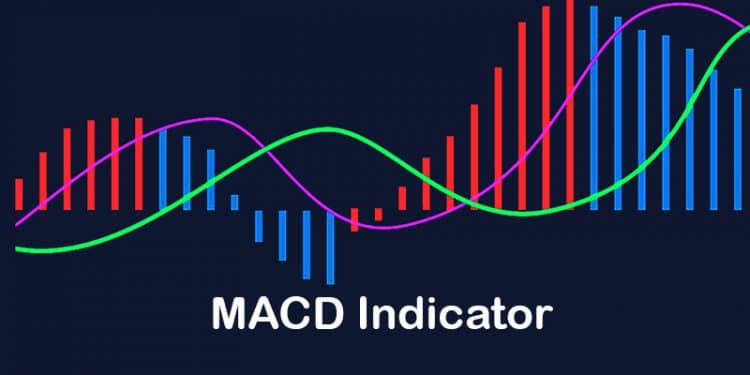
The MACD indicator is one of the most popular tools for conducting technical analysis in Forex. MACD, short for Moving Average Convergence Divergence simply measures the relationship between exponential moving averages or EMA. Normally the MACD displays a signal line in red, the main MACD line in blue, and the histogram is green.

Here, the signal line(red) represents an exponentially smoothed average (9 period) of the above MACD line. The MACD line(blue) represents the difference between the 12 and the 26 periods exponentially leveled moving averages. Both these lines flicker around the zero line, giving MACD the characteristics of an oscillator. It gives oversold and overbought signals below and above the zero line respectively.
The MACD indicator can measure momentum or trend strength. It uses both the MACD line and the zero line as reference points. Normally when the MACD line crosses below the zero line, it signals a downtrend, while when it crosses above the zero line, it signals an uptrend.
Additionally, when two MACD lines cross over, it signals to buy or sell orders. For instance, when the MACD line travels below the signal line, traders use it as an indication to sell. When the MACD line travels above the signal line, traders use it as an indication to buy.
History of MACD indicator
The origins of the MACD indicator are in the year 1970 when Gerald Appel first created the MACD line to reveal changes in the direction, momentum, strength, and duration of a trend in the price of stocks.
Another historical development happened in 1986 when Thomas Aspray modified Appel’s MACD by adding the histogram feature to it.
How MACD indicator can be adjusted?
To understand how traders can adjust the MACD indicator, we have to take a look at how it’s set up. It has the notational form MACD (a, b, c) with the letter variable denoting time periods. Here “a” and “b” refer to time periods used for the calculation of the MACD series. The a, b, and c parameters for the MACD are usually set to 12, 26, 9 by default. This is because of the previous era where the trading week was six working days instead of five.
The logic behind the default setting is as follows.
- The 12 period EMA tracks the trend over the past couple of weeks.
- The 26 period EMA tracks the trend of the past month
- The 9 period EMA of the difference between the above two tracks the past one and a half weeks.
Even though traders can freely adjust the above parameters at their own discretion, the majority of the traders still use the same settings. Technical analysis for forex traders is a profitable way to trade as traders follow the same cues which these indicators provide, with price moving accordingly.
Traders predominantly use the standard MACD setup. However, they can vary these settings to find out how the trend moves over other time periods or in other contexts. For instance, many traders use the MACD (5, 42, 5) settings. In other words, this sets the fast EMA to a week’s worth of data, the EMA of the signal line to 5 periods, and the slow EMA is to two months’ worth of data.
The difference between the fast and slow EMAs is wider in this case, making the setup more responsive to changes in price. Faster and more frequent signal line crossovers are created by the shorter EMA of the signal line.
Traders prefer using the MACD due to its ability to help them spot increasing short-term momentum quickly. By producing clear transaction signals, MACD helps in minimizing the subjectivity involved during trading. Traders can rest assured that they are trading in the direction of the momentum by being aware of the crosses over the signal line. As a result, MACD can be used and incorporated into a number of short-term trading strategies.
Basic Strategies using MACD
Before we take a look at trading strategies involving, we have to first take a look at some of the major signal groups.
We will take a look at the MACD Crossover and MACD divergence signals.
- MACD Crossover: MACD Crossover is one of the most popularly used indicators, involving the intersection of two lines. There are two types of crossovers
- Bullish MACD Crossover: A Bullish MACD Crossover forms when the signal line is crossed by the MACD line in a bullish direction, signaling that the price of a particular forex pair can increase.
- Bearish MACD Crossover: A bearish MACD crossover forms when the MACD line crosses the signal line, but in a bearish direction, indicating that the price of a particular forex pair can go down.
- MACD Divergence: The MACD divergence recognizes divergence as well. There are both bullish and bearish divergences.
- Bullish MACD Divergence: A bullish divergence forms when the bottoms of the MACD are increasing with the bottoms of the price action decreasing. It signals that a particular forex pair is about to embark on a bullish run.
- Bearish MACD Divergence: A bearish MACD divergence forms when the tops of the MACD decrease as the tops of the price action increases. This is an indication that the price of the forex pair may drop on a chart.
Examples of MACD technical analysis
- Divergence MACD Trading: The aim of Divergence MACD trading involves spotting either a bearish or bullish divergence to trade. The entry point is based on the crossover at the second top or bottom of the MACD divergence. Traders should hold the trade until an opposite cross Is formed by the MACD.

In the above H1 chart for EUR/USD for September 22 to 28, 2016 contains the MACD 2 line. In the chart, while the two tops on the chart increase, the two big tops at the indicator decreases. This indicates a bearish divergence between the MACD and price action. When the second MACD top forms, traders should short the EUR/USD pair at the bearish crossover. They should place their stop-loss order above the chart top and hold until the opposite MACD crossover forms.
- Crossover MACD Trading: Crossover MACD trading is a basic approach where the trader simply opens a trade when MACD cross forms. He/she should hold the trade until opposite cross forms.

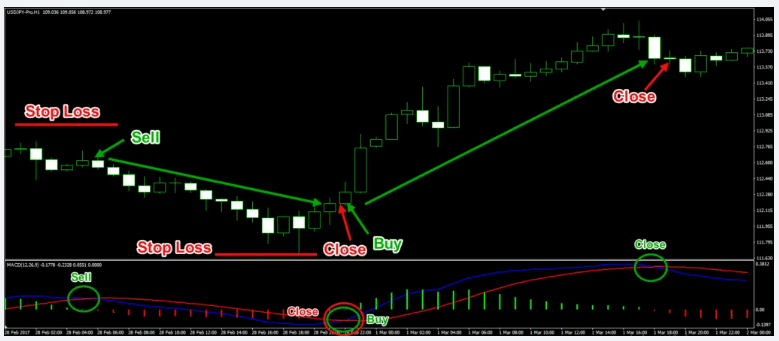
The above is an example of the H1 chart of USD/JPY, for the period February 28 to March 2, 2017. The first signal is when the MACD breaks the signal line downward and traders should sell the USD/JPY at this moment. Prior to the entry point, they should place a stop-loss order above the visible top. Traders should then hold the trade until the chart shows the formation of an opposite cross.
The opposite cross is another entry point in the chart. As the cross is bullish, traders need to close their short trade and open another bullish trade. They should place their stop-loss order below a visible bottom on the chart. Again the trade should be held until the trader detects another opposite MACD cross over.
The Bottom Line
MACD is one of the most used indicators that fall under the category of trend confirming. As it serves both as an oscillator as well as a crossover indicator, it allows for a less cluttered chart while trading by giving two signals in one indicator. Many traders have found this to be useful while conducting trade in the forex market.


