As you may infer from the name, price action trading is a method whereby traders rely on the price oscillations of an asset to make trading decisions. Traders study price movements, such as highs, lows, open, close, support, resistance, etc., instead of technical indicators.
Interpreting price action
One of the most important things to assess is by interpreting the trend. Traders look at the price patterns to determine whether a trend is about to continue or a correction is imminent.
A trend is deemed reliable when the size of an uptrend or a downtrend swing is larger than the intervening corrections. This can be done by looking at the respective lengths of swing highs and lows, which helps determine the likely direction of the trend.
The rule of thumb is that an uptrend is sustained by higher highs and higher lows, while lower lows and lower highs sustain a downtrend. These lows and highs ultimately form important levels of support and resistance.
Using price action in understanding supply vs. demand
In a typical market, increased supply usually results in price decline. Whenever suppliers bring in significantly high volumes of an asset into the market, prices initially fall as buyers mop up the excess supply. This results in a range or correction as buyers’ and sellers’ strength achieve a near-balance. If the sellers continue to increase supply, it results in a downtrend.
The market may have a reduced volume of the asset, causing the price to rise again. At this point, a trader should watch out since sellers may just return and increase the volume of their supply once more, consequently pulling down prices.
On the other hand, a spike in demand is usually a result of an increase in buying activity. This creates an uptrend. The uptrend incentivizes sellers to increase the supply to the market and consequently results in a range or correction as buyers and sellers try to balance their strengths.
Buyers may continue buying more, thus overcoming the sellers’ pressure, breaking out of the market correction, and resulting in an uptrend continuation.
Reversals in price action trading
Markets are unpredictable, and even a seemingly excellent uptrend can suddenly transition to a downtrend and vice versa. Such transitions are usually depicted by the changing character of the trend’s price action.
The most common way to spot a reversal is when the higher highs and higher lows suddenly begin to change into lower lows and lower highs and vice versa. It signals an impending end to the current trend and ushers in a new trend when that happens. The transition zones from either an uptrend or a downtrend may be well-defined market ranges or engulfing zones.
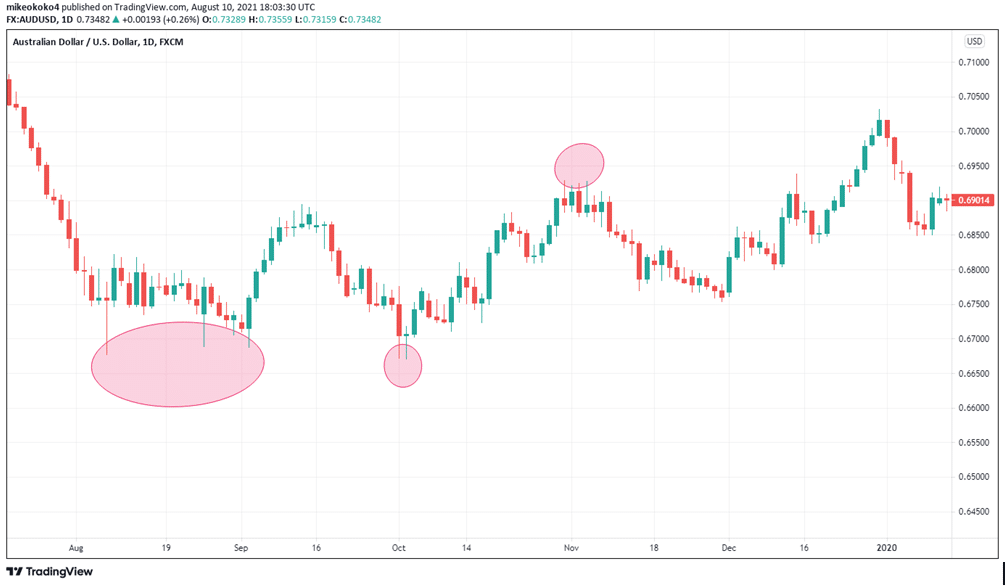
However, unpredictability is one of the characteristics of markets. Consider AUDUSD pair, for example, as shown in the chart below.
After the downtrend in July 2019, the market struggled to make new lows in August. Eventually, after a few retests of 0.6700, the trend reversed in September. The market kept making lower highs, while the lows stayed at the same level. In this situation, it’s pretty uncertain what direction the trend would take.

In early October, the short downtrend turned into an uptrend, making higher highs and higher lows, which would help us identify the trend’s change.
At the beginning of November, we see price bouncing off and reversing shortly, without giving any additional hints of an upcoming reversal.
Rejection in price action trading
There are times when a trend may be reversed temporarily, only for the market to “reject” the new price levels. This is called a price rejection, and it usually results in a return to the previous price action trajectory. Rejection is usually a result of the failure by the bulls to sustain a high price level or failure by bears to sustain low prices, leading to a reversal.
You should be on the lookout for the following signs of rejection:
- When the price starts touching critical support or resistance level
- When the candlesticks begin having long tails
- When the market momentum reduces, as indicated by reduced trading volume
- When the price reverses to an opposite trend direction
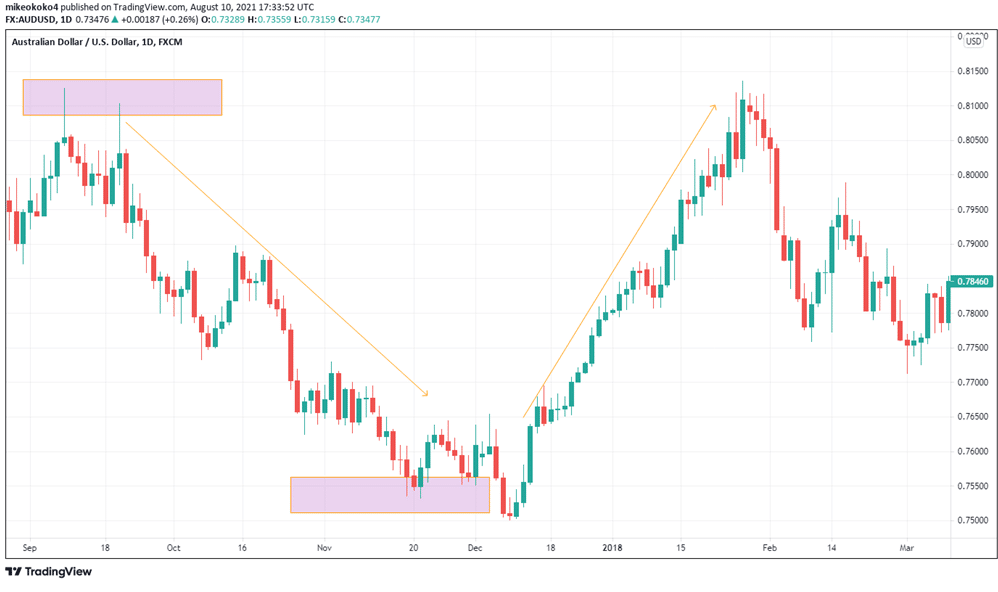
The AUDUSD chart below shows the price action that follows the long candlestick tail, indicating a failed attempt to sustain the breakout.

The market also found support around 0.7550-0.7500, testing the area three times before the bullish reversal.
Price action in scalping
Scalping is a common practice, especially in forex trading, where traders target small profits from short-interval trades, usually lasting less than a minute. To increase their profit margins, scalpers usually open up hundreds of trades.
Scalpers rely on price action to make several quick trading decisions. For instance, a trader may go for a seven pip profit target and a four-pip stop loss, executed within a minute. By evaluating the price action, a trader increases their chances of making a profit and reduces the chances of losing because of the short timeframe.
Pros and Cons
Cons
As traders rely on their market perception for decision-making, price action trading may have a large margin of error since indicators are not involved. This gives room for misinterpretation of the potential outcome of a particular strategy. Without indicators, it may not be easy to accurately read the information relayed by a price action trade setup.
Pros
By focusing on a single determinant, price action trading saves time and gives traders a clearer understanding of a trading setup. On the other hand, using several indicators can be confusing and tasking to traders and take a comparatively longer time to set up.
Some indicators are complex, and simultaneously using several indicators may relay conflicting outcomes, leading to indecisiveness.
In summary
Trading price action is simple, and it can be profitable if interpreted correctly. However, the absence of indicators in a trading strategy also leaves room for misinterpretation of the market and can increase losses.


