Range bars appeared in the 90s and are recently getting some traction with seasoned traders. They are useful tools that allow you to determine and understand the volatility present in the market and time your entries accordingly. Let us take a look at what range bars are exactly.
What are range bars?
Unlike charts that operate on the basis of time, there is no fixed bar count for range bars during trading sessions. When the number of bars is high, it indicates a period of high volatility, whereas fewer bars indicate low volatility. The exact count of the bars depends on the asset in question and the price shift for every bar.
Benefits of range bar trading
The benefits of trading with range bars are as follows:
- They aid in the smoothening of price action and remove a significant amount of market noise.
- With them, you can reduce the possibility of false signals appearing and minimize chopping action periods.
- They clearly point out possible resistance and support areas.
- You can reduce the indicator lag time or remove it completely.
- They enhance the accuracy of indicators by taking time out of the picture and concentrating only on the price.
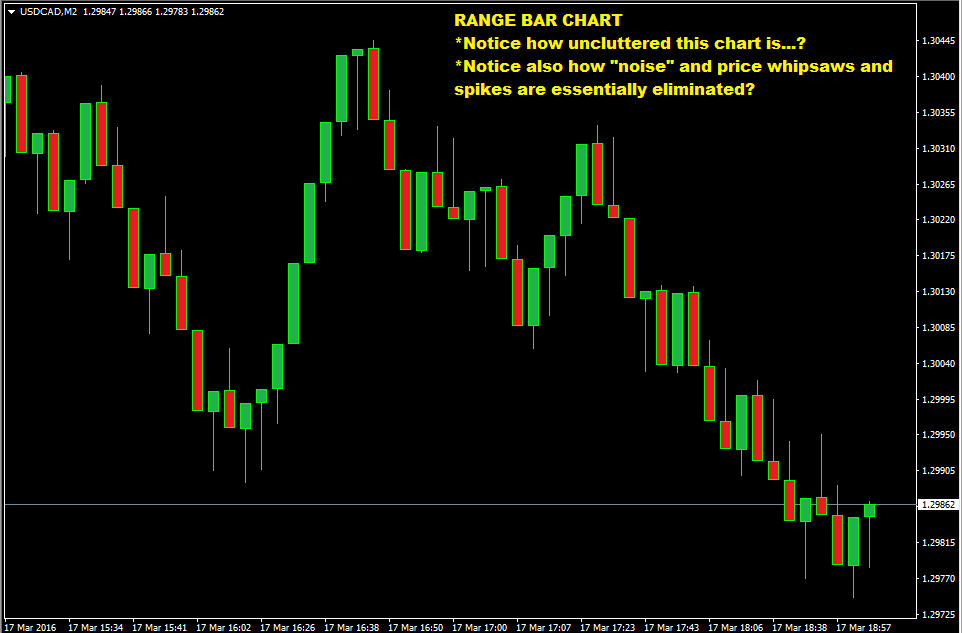
How is the price calculated by range bars?
Range bars only deal with time. So, with each formation of a bar, there occurs a definite price swing. Many traders work with time-based charts like 17-minute charts where each bar depicts the movement in the price for 17 minutes. No matter what the trading volume or volatility is, these charts will always show a fixed count of bars.
Since it is only price movements that influence range bars, the creation of a new bar depends on whether a particular range has been satisfied or not. For instance, if $20 is the defined amount for range, it indicates that the range of each bar is $20. This means that one range bar could hold the price movement over multiple days, provided it is restricted to $20.
After the closure of a range bar, the next one begins at the price where the previous one closed. These charts have no gaps, and in case a price gap appears, dummy range bars are included as compensation. These virtual bars have zero volume and represent no price movement.
Range bars trading strategies
Let us discuss some range bar strategies you can use for trading.
F4 strategy
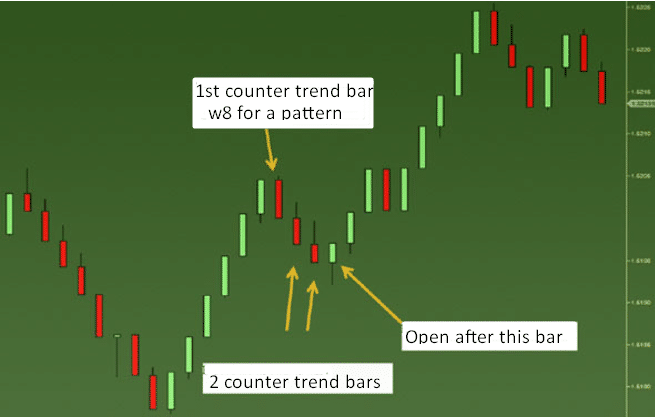
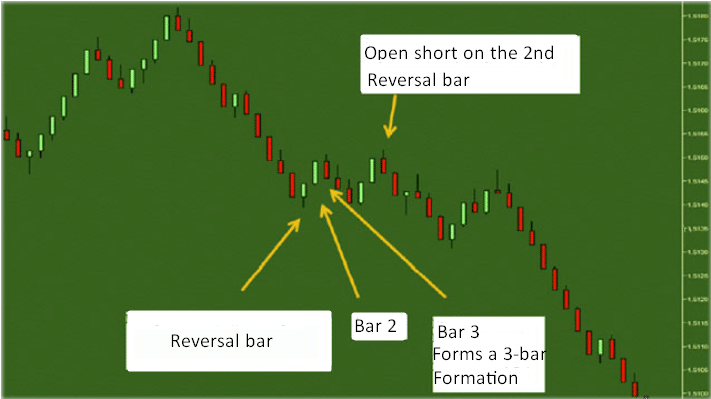
If you are a long-term trader looking to trade in the Forex market, this strategy will be quite suitable for you. The F4 pattern begins when a reversal range bar forms contrary to the trend. There are three counter trending bars in this pattern, and it concludes with the formation of the reversal range bar.
Using this scheme, you can take advantage of intense price movements through entry signals that are highly probable. When a new F4 pattern occurs due to pullback or when the price manages to escape a region of resistance or support, you should place a fresh order.
The above chart depicts a genetic pullback where there are four range bars. In this regard, you should remember that the confirmation of the trend must take place when the timeframe is high. When the pullback occurs, and the range bars are formed, it is a perfect occasion to make an entry. The second chart shows a situation where two pullbacks took place back to back, each creating three bars.
MFI indicator strategy
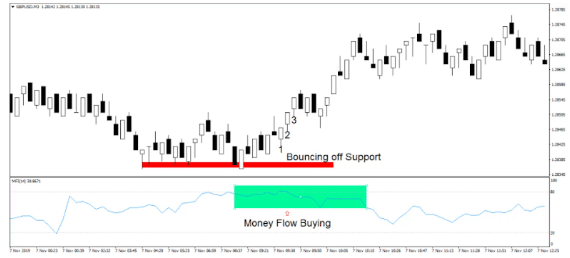
This scheme involves the MFI indicator to corroborate selling and purchasing pressures behind the enhancement of range bars. An upside expansion of the range bar serves as a good buying signal, as shown in the chart above. Here the MFI indicator is used only for confirmation purposes.
MA and MACD strategy
For this purpose, we require the EMA and SMA for 12 days as well as a 2-line MACD.
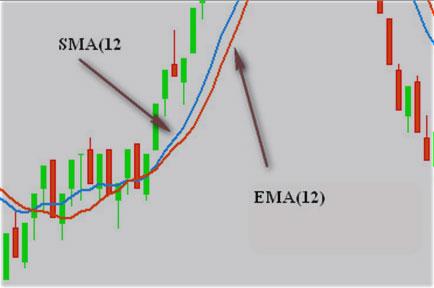
After selecting your asset and adding the indicators, the chart will appear like the one above. Entry conditions are met when the MACD lines move beyond the oversold or overbought regions, the range bar ends above or below the point of crossing, and the EMA crosses the SMA. Subsequently, you should enter a trade when the next range bar appears.
Cloud scalping strategy
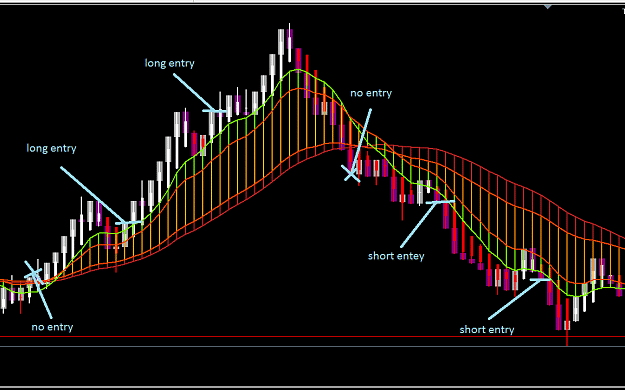
This scheme consists of range bars, MAs forming a cloud, and Heiken Ashi. Long positions are to be taken whenever the price lies above the cloud, and short ones are to be taken when the price lies below.
After the red portion of the cloud has been broken through by the price, the trend might shift. But, you can confirm this only when you see a pullback occurring. Now, short positions can be sought out easily. It is advisable not to trade in a ranging market, and you should wait for the breakage of the range’s low or high and a pullback, so you can start entering trades after confirming the trend.
How to trade with range bars?
Using range bars, you can look at the price in an integrated form. They help you point out the exact price occurrences since the noise is reduced and a new bar appears only after the fulfillment of a defined price range.
Trendlines can be easily drawn on these charts due to the absence of noise. By using horizontal trendlines, you can emphasize the resistance and support areas, whereas bearish and bullish trend lines can help highlight trending periods.
Summary
Here, we got to know about range bar charts, their advantages, and how you can use them for trading purposes. If you are a fan of technical analysis, range bars will let you see the price movements more accurately. This can make a huge difference in a volatile market.

