
The Relative Vigor Index (RVI) is an indicator that enables the assessment of the market momentum to establish whether the recent price movement will continue in both the short and medium-term. It is different from other oscillators in that it gives more weight to the closing price compared to the opening price.

How RVI works
Because it is an oscillator, the RVI fluctuates both above and below zero, giving rise to both positive and negative numbers. The RVI and the Weighted Moving Average that accompanies it generally oscillate around a centerline on the indicator display. High values are taken as signals to sell and indicate an overbought position. On the other hand, whilst low values indicate a strong oversold condition.
How to interpret RVI
Based on how it moves, RVI is not functionally too different from other oscillators. We read it in the same manner as RSI and MACD. A divergence in the RVI’s reading from the price chart indicates an overbought or oversold condition.
Below are key pointers on how to trade with it.
- Overbought vs. oversold markets: Look for the RVI to move away from overbought or oversold zones for a signal to sell or buy if the market is still flat. There is no definite range of levels for either extreme, so traders will have to figure this out for themselves. In addition, it is important to keep in mind that oscillators might stay at extremely high or low values for a lengthy period of time.
- Divergences and convergences: Divergences arise in the market when an underlying asset’s price moves in the opposite direction of an indicator’s readings. Signals of imminent price breakouts, such as divergences, often come just before market corrections. Straight and subtle divergences can be found in the marketplace.
When the asset price makes lower lows while the RVI makes higher lows, this is referred to as a straight bullish divergence. Traders will try to put buy orders in expectation of an upward price reversal as a result of this perceived momentum weakness.
When the RVI registers lower highs while the price is hitting higher highs, we have a bearish divergence. This sends traders into action by initiating sell orders because it is a bearish divergence.
- Crossovers: Opportunities arise when the RVI and the signal line cross over each other from either up-down or down-up. It’s a bullish signal when the indicator crosses over the signal line. In contrast, when the red line goes above the signal line, it shows there’s imminent bearishness.
How the lines function
- The green line: The green line arises from the RVI’s Simple Moving Average. Its default timeline is 10-periods, but it can be adjusted to fit a trader’s style.
- The red line: This line plots a 4-period volume Weighted Moving Average across four periods. The crossovers between the green and red lines send either buy or sell signals. For that reason, the red line is also referred to as the “trigger line.”
RVI trading strategies
The RVI, like any other indicator, is susceptible to erroneous readings. As a result, it’s best to use it in conjunction with other trading tools to spot fakes.
- RVI and two Moving Averages
There are no hard and fast rules when it comes to the duration of Moving Averages you can use.
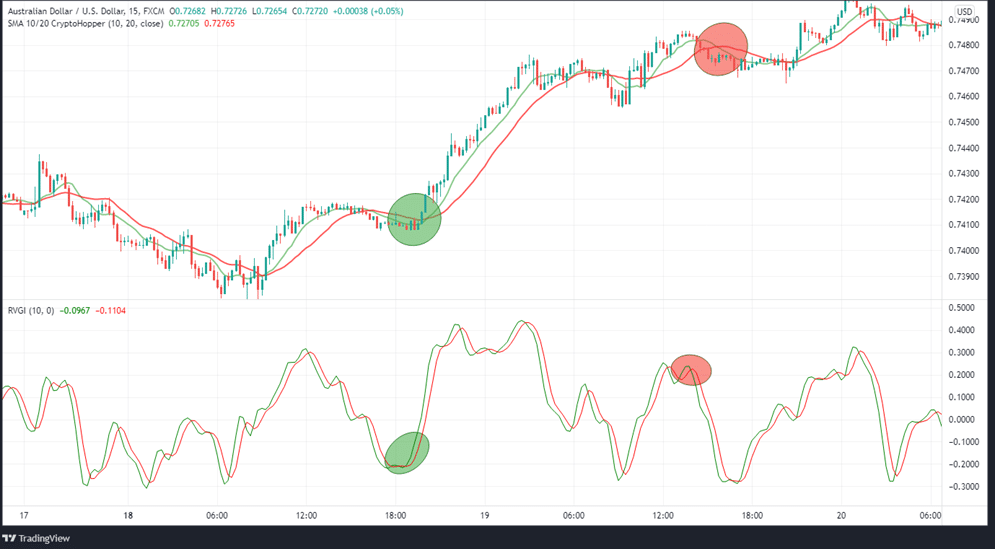
In the example above, we have used RVI in conjunction with the 10-period and 20-period SMAs. In this case, it is advisable to use RVI signals to open new positions when the two SMAs cross in the direction of the position you want to take (green). Alternatively, you can exit the market if the SMA crosses in the direction opposite your trade (red).
- RVI and MACD
In the AUDUSD 15-minute chart, we wait for signals from both the MACD and the RVI indicators before taking a position.
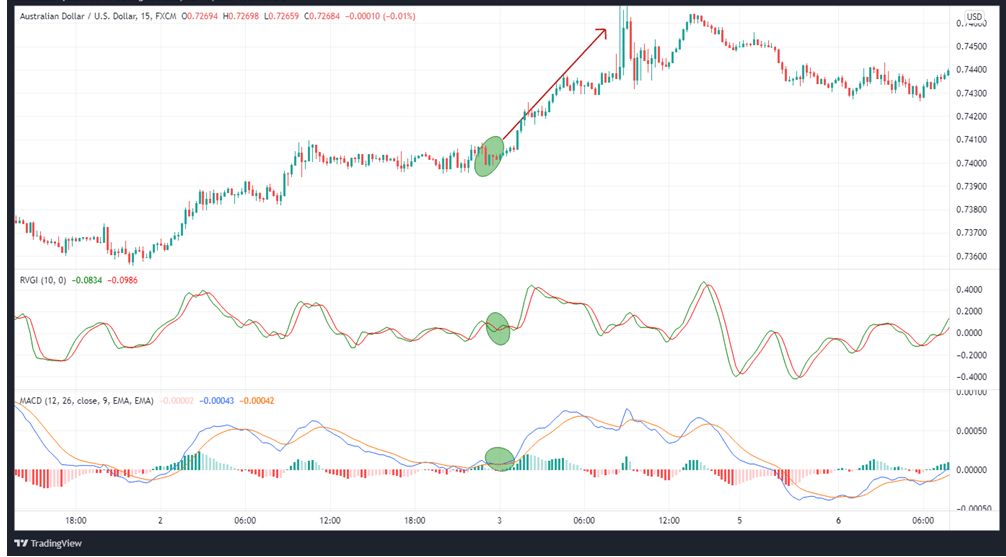
In this particular instance, go long at position A.
- RVI and the Stochastic Oscillator
In the AUDUSD chart below, the two green circles tell us when both the RVI and the stochastic oscillator get into oversold territory.
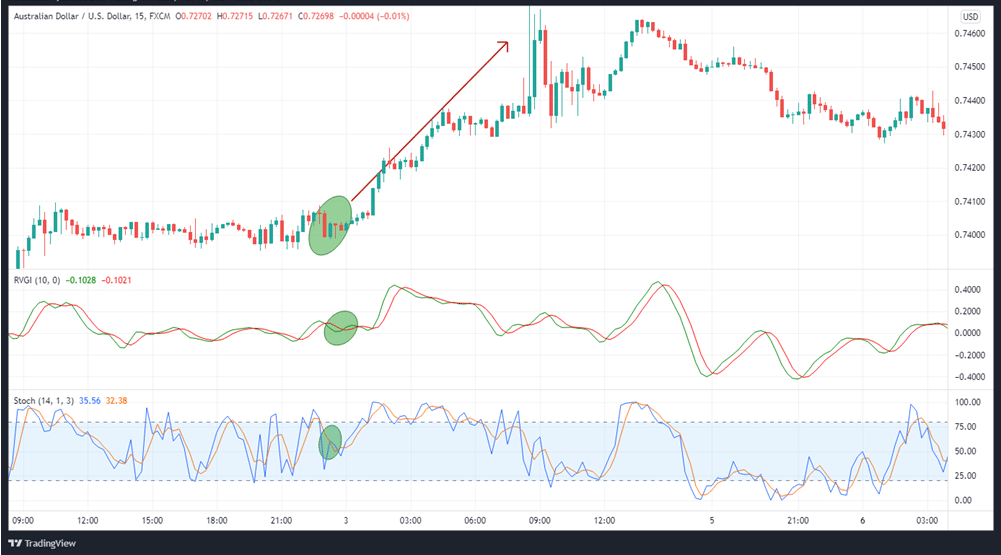
As a result, we buy when the RVI’s green line crosses the red line, indicating the beginning of a new bullish trend. The pair appreciates significantly thereafter, leading to a profitable trade.
In summary
The RVI measures the strength and reliability of price changes in a market. It relays signals that can help traders know the appropriate time to enter or exit positions. When the RVI rises, traders expect it to signify a change in market direction and to climb in bullish markets when momentum is building, and closing prices exceed opening prices. The opposite applies to bearish markets.
![TradingView vs Thinkorswim [A Comparative Review]](https://myfxtools.com/wp-content/uploads/2021/11/TradingView-vs-Thinkorswim11-75x75.png)
