
The Relative Strength Index is a common and popular technical analysis tool leveraged when trying to ascertain the strength of the current market. The tool also provides valuable insight into the direction the price of a cryptocurrency or currency is moving and is likely to move in the future.

RSI basic structure
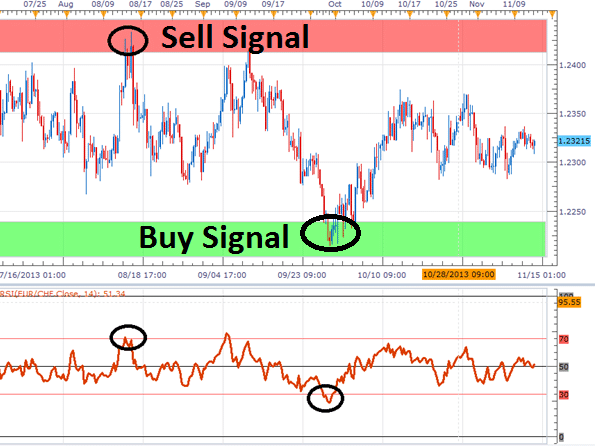
As one of the simplest indicators, the RSI comes with readings between 0 and 100. It oscillates between these values based on the prevailing market condition. Whenever there is strong buying pressure in the forex or crypto market, it will cross the 50 line and move up. Conversely, the indicator signals bullish momentum with readings above 50. In this case, traders eye buy positions.
Similarly, if short-sellers are piling pressure with sell orders, the RSI will trend lower, and its readings will be below 50. When the RSI readings are below 50 and decreasing, it implies strong bearish momentum implying the market is on a downtrend. Conversely, traders eye short positions in this case.
RSI: Overbought
Strong buying pressure often results in the underlying asset being bought far too much. When there is too much buying, the RSI reading will be above 70, implying an overbought market condition. Given that the underlying currency or cryptocurrency is overbought, the prospect of a potential price reversal occurring is usually high.
When a currency or cryptocurrency is overbought, the prospect of new buyers entering the market to help push the price higher is usually low. In these conditions, smart money tends to pull out of the market by closing positions and locking in profits. This is why prices tend to reverse.
Some traders use this opportunity to enter short positions to try and profit from price reversing and moving lower from the uptrend. However, it is important to note that an asset price can remain in overbought condition for quite some time before a reversal comes into play. Therefore one should never enter a short position just because the RSI is above 70
RSI: Oversold
Oversold is a market condition that comes into play whenever the RSI reading is below 30. It implies a cryptocurrency or a currency has been significantly sold to some of the lowest levels. Such conditions tend to trigger price reversals as very few sellers are usually willing to continue selling to push prices lower.
As smart money exit the market by closing positions to lock in profits, there is usually a tendency for prices to bounce back and move up. While it is common for bulls to enter long positions when the RSI is overbought, it is important to wait for further confirmation. The risk of an instrument remaining in oversold condition and failing to bounce back is usually high.
RSI Moving Average Crossover strategy
For the best outcomes, the RSI should never be used in isolation to make trading decisions. Instead, it should be used to supplement other indicators and candlestick patterns to have a more realistic idea of what is happening in the market.
Conversely, one of the best strategies is using the RSI in combination with a Moving Average. The RSI will be used to shed light on the prevailing market condition, while the MA will be used to pinpoint the ideal entry-level.
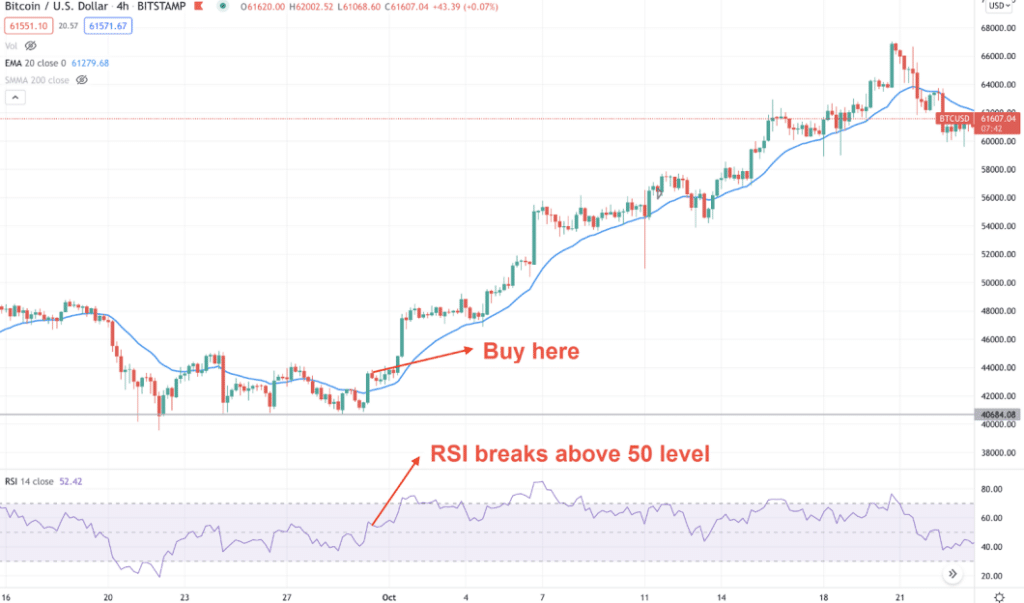
In the chart above, Bitcoin was edging lower in the first half, depicted by the RSI edging lower and deep into an oversold condition with a reading of less than 20. After some time, the RSI started moving up in line with the price also moving up. But there was no clear direction in the market as any bounce back was countered by a strong sell-off that resulted in the Bitcoin price tanking.
Given that RSI has already bottomed out of the oversold condition implying waning short-selling pressure, it would be wise to pay close watch to the 50 Moving Average, tracking price in the chart. In the first half, when the price was moving lower, the Moving Average was above, with any bounce back to the Moving Average acting as a selling opportunity from which short sells pushed the price lower.
However, when the price moves above the Moving Average and stays above, there comes a time. The formation of a bullish candlestick above the MA when the crossover happens implies strong buying pressure. This would be a solid confirmation that bulls have overpowered bears and that price is now poised to move up.
With RSI above 50 implying bullish momentum and price above the MA suggesting the start of an uptrend, this would be the best time to eye buy positions. An ideal entry-level would be whenever the price pulls back to the Moving Average.
RSI Divergence strategy
In most cases, it is expected that price and RSI will always be aligned and move in the same direction. Conversely, when the RSI is moving up, it is expected that the price will make higher highs and make lower lows whenever the RSI is moving lower. However, that is not always the case.
There comes a time when the RSI and price move in the opposite direction, hinting at potential price reversals. Therefore, traders looking to profit from price reversals watch these formations closely.
For instance, whenever the RSI reverses course from the downtrend and starts moving up but the price continues making lower lows, it acts as a warning of a potential price reversal. The prospect of the price reversing course and moving up in line with the RSI is usually high.
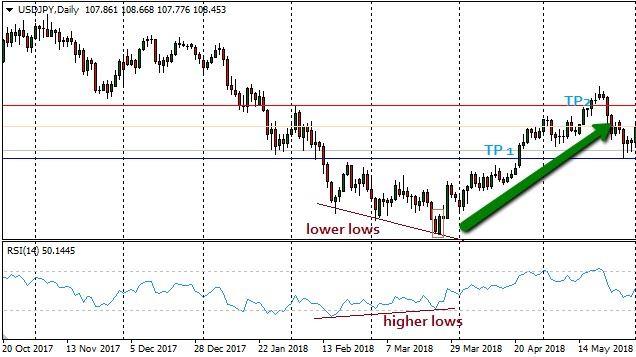
The bullish divergence, in this case, implies users are increasingly flocking the market and overpowering short-sellers, thus the reason the RSI is moving up. Conversely, traders use this opportunity to eye a long position in anticipation of price reversal to the upside.
Similarly, whenever the RSI is moving lower, making lower lows, but the price continues moving up, making higher highs, technical traders pay close watch to potential price reversals. The divergence, in this case, implies short-sellers are increasingly flocking the market, thus bearish momentum that is causing the RSI to move lower.
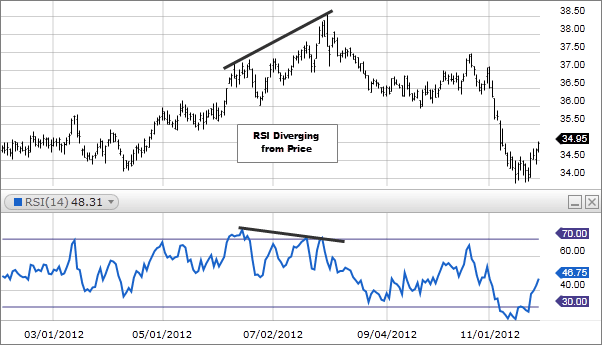
In the chart above, RSI was moving lower even as the price moved higher. However, after some time, the price reversed and started moving lower. Therefore, traders position themselves for potential short or sell positions whenever there is a bearish divergence as the prospect of price moving lower is usually high.

