Trading technical indicators such as Simple Moving Averages (SMA) and Exponential Moving Averages (EMA) are employed in market analysis to assist traders in gaining a better knowledge of market patterns. Because traders need a clear picture of the market’s activity, these tools “smooth out” price bars, providing a clear image of the prices over a period of time. Rather than being used to predict new trends, Moving Averages are more commonly used to confirm existing ones. If the price follows the same trajectory as their MA, it is easier to confirm the trend.
SMA and EMA have many similarities, but their major distinction is the way the calculation is done. Although SMA is the most widely utilized average, there are several situations in which an EMA may be more appropriate.
EMA values take into account more recent prices and are thus more useful for short-term analysis. For traders who focus on the short term, it doesn’t matter which average they choose, as they will have the same outcomes no matter what. However, for traders with a long-term focus, figuring out how to use indicators is important, as they must ensure their indicators match what they want to show them.
When is it appropriate to use EMAs?
EMAs are generally only used to validate price action, which means they rarely operate independently. Many traders utilize them with other indicators to help validate significant market swings and, in doing so, bolster their credibility.
You may find it difficult to rely on the EMA when it comes to discovering a profitable new trade. The importance of this indication may be found in the fact that it may be used to evaluate a trading hypothesis as well as to confirm or dispute the recommendations offered by other indicators.
When should SMAs be used?
Some people are probably skeptical about SMAs, but they nevertheless hold up against every opposition. What’s special about them is their flexibility. One of the best ways to utilize SMAs is to use them to detect when an asset is experiencing a change in direction or increasing/decreasing in value, and then assess the strength of its momentum and see if the asset is facing any obstacles.
Another helpful feature of trading on SMA time frames is that traders can set their own time frames in which they analyze a currency pair’s long-term performance and so assess where they think price movements are headed. Even though they’re far from the most complex or advanced technical indicator, SMAs can still be useful as part of a trading plan.
Is EMA the better option compared to SMA?
Many traders in the industry employ both EMA and SMA because of their respective importance in identifying trends. Whether one is superior to the other will often be determined by your tactics.
Although the two indicators don’t appear complex, they are vital for technical analysis. Because of a higher priority on current prices, the EMA has a certain amount of traction among traders. Nevertheless, before selecting EMA over SMA, you need to keep in mind a few other factors.
EMA analyzes recent price fluctuations
The SMA is a currency pair’s average price over a particular time period. Using the daily closing prices of the previous 50 days as an example, we can compute the 50-day Moving Average by multiplying the sum of the closing prices by 50. With each recalculation, fresh information becomes available, which is referred to as “Moving Average.”
With the addition of the EMA, the average given weight more precisely reflects fresh market data. This occurs because it incorporates the current prices into the calculation by making the most recent values more significant. So, over a long period of time, the difference between the EMA and SMA becomes more evident.
EMAs, therefore, deliver more effective results for traders such as day traders and scalpers, who utilize short-term strategies. SMAs, on the other hand, is preferred by position traders and swing traders.
Practical example
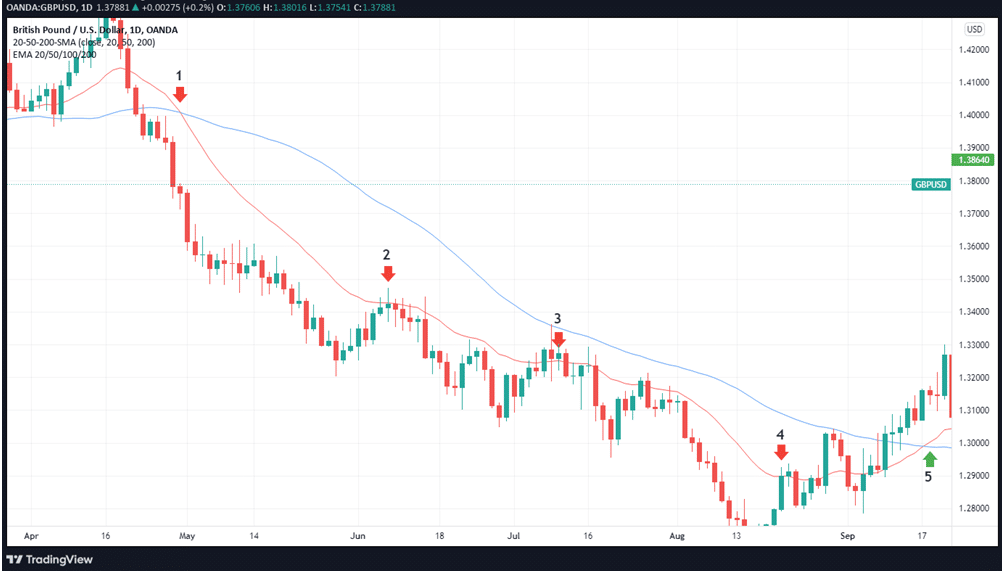
Let’s have a look at the illustration below of how we might use the combined SMA/EMA with the medium-term trend definition to see any shifts in trend.
Moving averages can be seen in the chart below.

This approach is known as a Moving Average crossover. Long-term trends and potential locations of support or resistance are identified using the SMA (blue line), whereas the shorter-term EMA (red line) is utilized to indicate prospective shifts in the trend that could lead to profitable trading opportunities.
Explanation of the trend
1: We notice that the 50 SMA is crossing below the 20-EMA. This would signify a possible reversal from bullishness to bearishness. A trader may use this area to initiate a short sale or to sell a security and profit by buying it again at a lower price.
2-4: As the market goes down, we will be paying attention to the longer-term SMA to find out if it might show us whether the prices are going to rise and the downturn will continue. The next example clearly demonstrates the peaks in price, which ran up to touch the 20-SMA, yet each time, the price failed to break the SMA and was forced back down.
5: The final result is that price has broken through, and its subsequent candles have closed above the SMA. The EMA has risen above the SMA, suggesting a shift from a downward trend to an upward one. Traders in this region would leave their short positions to enter longs by placing purchase orders.
In summary
After comparing EMA with SMA, we can conclude that EMA is a stronger market analysis tool for short-term analyses. However, SMA does not perform as well when predicting longer-term trends.
So, if you are an intraday trader with short-term goals, then you can rely on a 100- or 200-day Moving Average to understand the market. And then, for any future trades, the previously described methodology may be used in addition to the support and resistance levels.


