
Trading indicators are technical tools that help determine momentum, trend, volatility, exit/entry, etc. They are present in the toolkit of every price action trader. No matter if you are trading forex, stocks, or futures, this automated software can aid in improving your results.

Every indicator can be useful for its own purpose, and there is a particular class that a trader should not rely too much on in their decisions. Our article will discuss what the most popular lagging indicators are, how they may affect your trading, and how they can benefit you.
What are lagging indicators?
A lagging indicator attempts to predict market movement after calculating previous price action. They are good for backtesting as they can confirm whether your strategy would perform well with the past event and let you understand how it will perform in a similar setup in the future. These tools are also helpful in ensuring the current strength of the trend, but you should be cautious with them for a reason.
Demerits of lagging indicators
There are certain disadvantages of using lagging indicators in your trading:
- They depict history rather than focusing on future movements.
- It may be too late for you to enter the trade when the signals come.
- They may underperform in ranging the market. A good example is the moving average crossover.
- The indicators don’t take into account key levels.
Application of lagging indicators
Applying lagging indicators to charts can help you understand how using them can be harmful to your trading. Let’s consider several examples and show how they perform in real-time.
Moving averages
The 20 (red), 50 (black), and 200-period (green) simple moving averages are among the most frequently used technical indicators in determining the current trend and support and resistance levels. However, as they are lagging, using them in your trading strategy may not be fruitful.
At the beginning of February 2021 there is a bearish reversal as you can see in the picture below. However, the 20-period SMA crosses the 50-period SMA a while after the actual reversal.
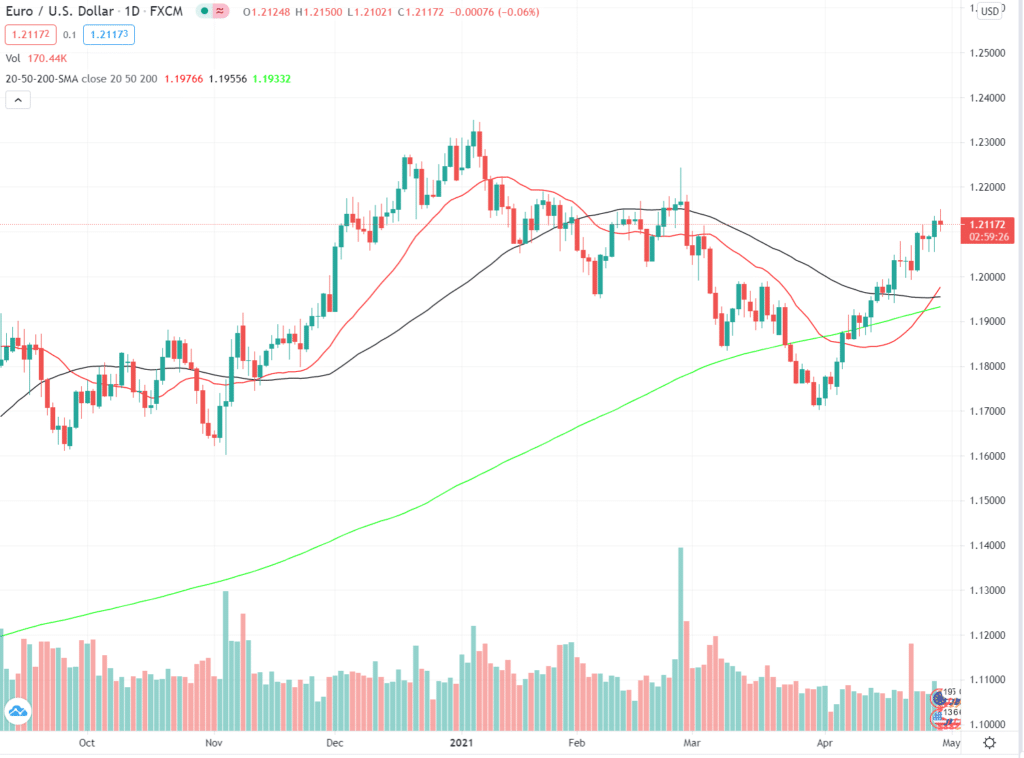
Image 1. The bearish reversal in early February 2021.
Traders use MA crossovers to predict reversals in the current trend, which may work, but placing trades in such an environment will lead you to more losses. They may also be ineffective when the markets are ranging.
MACD
MACD stands for Moving Average Convergence Divergence. It works well for predicting the momentum. Again, more often than not it fails to predict the future. As a result, some traders regard MACD as a hybrid indicator as it also depicts overbought and oversold conditions.
Based on the dynamics of two exponential moving averages (EMAs), 12 and 26-period, this indicator works similarly to the combination of SMAs above: when a shorter-period MA line (blue) crosses a smoother one (orange), the trend is bearish. Hence, when the blue line (12 EMA) crosses the orange one (26 EMA) from below it generates a bullish signal. The red and green bars indicate the momentum.
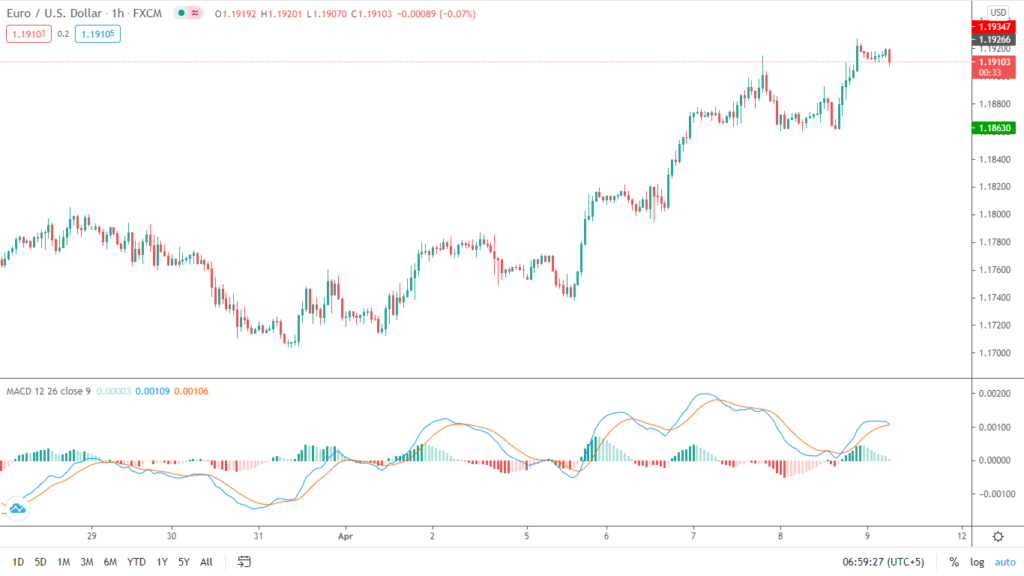
Image 2. Can you notice how the crossovers that can be misleading in the MACD indicator now?
Stochastic Oscillator
Developed in late 1950 by George Lane, Stochastic Oscillator is also a momentum indicator that uses moving averages. It is easy to understand that any technical tool using MA in their algorithm is regarded as a lagging indicator.
While the stochastic leads in terms of predicting momentum, it lags when it nears the crossover.
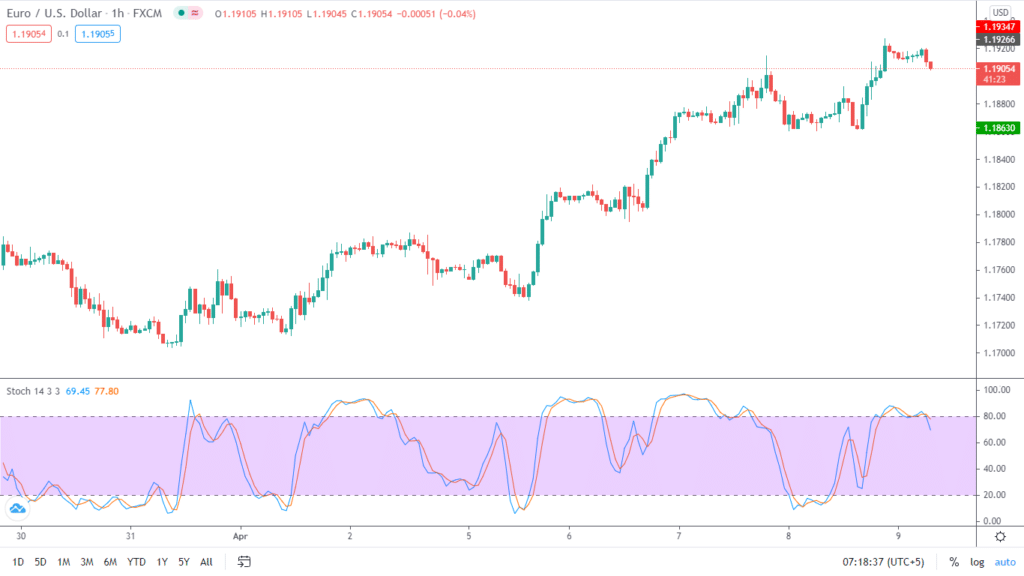
Image 3. The Stochastic indicator also shows overbought and oversold conditions. In tradition when the %K and %D moving averages ( period 3 in our case) are above point 80 the market is in an overbought state. If they are below 20 then it is in an oversold state. Frequent crossovers might be confusing for beginners.
Bollinger Bands
Bollinger Bands only react to price movements by moving either up or down but fail to predict how they will form in the future. Traders can only use it to gauge trends or breakouts but cannot make final decisions on the indicator alone.
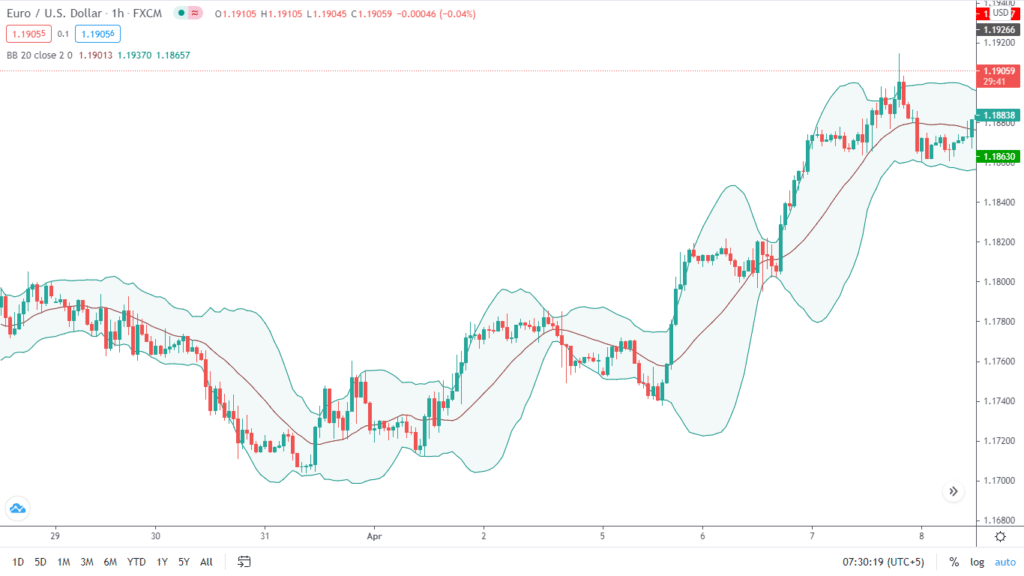
Image 4. As the market volatility increases or decreases, the Bollinger Bands contract or expand. However, the middle line, which is the basis, acts only as a lagging indicator on the notion of being a moving average.
Other types of lagging indicators
Economic lagging indicators are the fundamentals released by the governments monthly, usually on specific days, and at a specific time. You can regard them as delayed: the market had already shown its reaction to them before they were announced.
Unemployment, the average prime rate charged by banks, and the change in the Consumer Price Index for Services, interest rates, GDP corporate profits, and labor cost per unit of output are good examples.
Lagging indicators in business are the key performance indicators, or KPIs, like sales, revenue, free cash flow, gross income, etc., published in the monthly, quarterly, and annually. They summarize how the company has been performing.
The bottom line
Various tools are sold for hundreds and thousands of dollars with no recorded performance.
Many novice traders give in to these indicators and robots, resulting in a loss of money. Always check the statistics of any software before actually purchasing one.
Also, keep in mind that these tools will only help you to a certain extent. You have to use the proper risk management and mindset to succeed.
To finalize the key points about the lagging indicators, let us contrast them with the leading ones.
| Leading Indicators | Lagging Indicators |
| Predictive, actionable, and relevant to objectives | Focuses on past behavior and incidents |
| React quickly to price changes, hence suitable for short-term traders and scalpers. | React slower to the change in the prices. Thus, traders get confirmation on the legitimacy of a trend. |
| Tends to give false signals during fakers or false breakouts | With lagging indicators, traders won’t be trapped by a false breakout. |
| Leading indicators help traders catch the initial move of a trend | Lagging indicators are slow; hence traders anticipating entering based on it get up getting a high price |

