Stochastic Oscillator is another indicator from the category of oscillators (look at its name!). Like other oscillators, it works best in the range market environment.
The indicator consists of two lines – %K and %D. The “oscillation area” of the indicator has two key levels – 80 and 20. When %K and %D are above 80, it indicates an overbought condition. Conversely, when %K and %D are below 20, the instrument is considered oversold. When %K crosses below %D while being overbought, it generates the sell-short signal. When %K crosses above %D while being oversold, it is a buy signal.
And here is the formula of the indicator:
The calculation for %K:
%K = [(C – L14) / H14 -L14)] x 100
Where:
C = latest closing price
L14 = Lowest low over the period
H14 = Highest high over the period
The calculation for %D:
%D = simple moving average of %K (3-period simple moving average is the most common)
Reversals follow the change in momentum
George Lane developed the stochastic Oscillator in the late 1950s, initially for trading stocks.
According to Lane, the indicator is designed to show the speed or momentum of price. Lane believed that the change of the price follows the change of the momentum or speed of the asset. The stochastic Oscillator is designed to spot this change and offer opportunities to trade the reversal that follows. Lane considered the turn of the momentum as the most critical trading signal for making trading decisions.
The author of the indicator suggests that the indicator can be used for profitable trading along with Fibonacci retracements or with Elliott Wave theory.
How is the Stochastic different?
The Stochastic Oscillator is very similar to other oscillators, like RSI, for example. The choice of what particular indicator to use largely depends on your personal beliefs about the principles the indicator is based on.
In general, RSI’s formula is more suitable to measure the speed of the price in a broad sense. Hence, RSI can still be applied to the trending market. Stochastic Oscillator also measures the momentum; however, its formula is more suitable for particularly choppy, ranging markets.
The Stochastic Oscillator bases its work on the following tenets:
1. The prices in an uptrend tend to stay at or above the latest closing price.
2. The prices in a downtrend usually stay below or equal to the latest closing price.
According to the tenets above, the indicator aims to compare the asset’s price relative to its price range during the defined period.
Limitations of the Stochastic Oscillator
Like any other indicators, Stochastic has its limitations. The most significant one is the tendency to generate many false signals during highly volatile market conditions. For this reason, you can consider using the indicator more actively on calmer currency pairs, such as AUDUSD or NZDUSD. The pairs tend to have generally a trending character due to their dependency on commodities. However, when they turn into a ranging state, it tends to be less volatile than those of the European trading session.
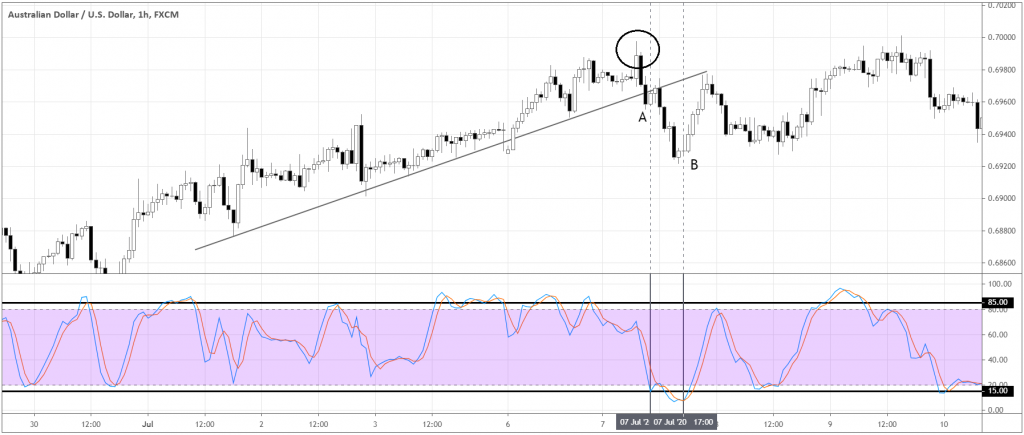
Some traders cope with the indicator’s false signals by setting the overbought and oversold levels wider, for example, 85 and 15 respectively. It can make the indicator less sensitive and reduce the total number of generated signals. However, there is a possibility to miss good setups too. You need to find the balance. It comes with experience and solid logic behind your decision-making mental algorithm in case you’re a discretionary trader.
Develop your mental framework
Let me give you an example of a mental algorithm when dealing with the ambiguity of this indicator.
Here we have AUDUSD that had a short term up-trend since the beginning of July. I defined it by a trendline. The first sign of the inability of the trend to continue is shown by the failed breakout of the last high (circled). It gives us a reason to assume that the market might turn into the range state.
Look what happens at the point “A” (marked on the chart). The fast line (%K – the blue line) of Stochastic moves to the oversold area a little below 20.
The first thought might be to buy a pullback. However, we keep in mind that Stochastic doesn’t work so well in the trend conditions, so we need a stronger, more extreme signal. Also, the market has broken the trendline indicating a possible reversal. Overall, although we argue the range market (inability to make new highs), the reason for the trend reversal is there as well (broken trendline). Quite ambiguous. Therefore, it’s better to wait and see if it can reach 15, a stronger oversold signal.
At the point “B” the market falls below 15. Looking at the price action, we can see a quite overextended down-move without a meaningful pullback. For me, it’s an excellent setup to buy AUD.

Keep in mind, like RSI, the indicator isn’t designed to gauge the price direction. You can measure the pace of the price move or momentum with the Stochastic. Based on the discovered momentum, you need to use other market analysis methods to confirm or define a specific entry trigger.
The main three trading signals of the Stochastic
Stochastic has three common types of trading signals. Two of them play the role of conditions that can be part of a general trading approach and one provides a trigger to enter the market by itself. Let’s see them closer.
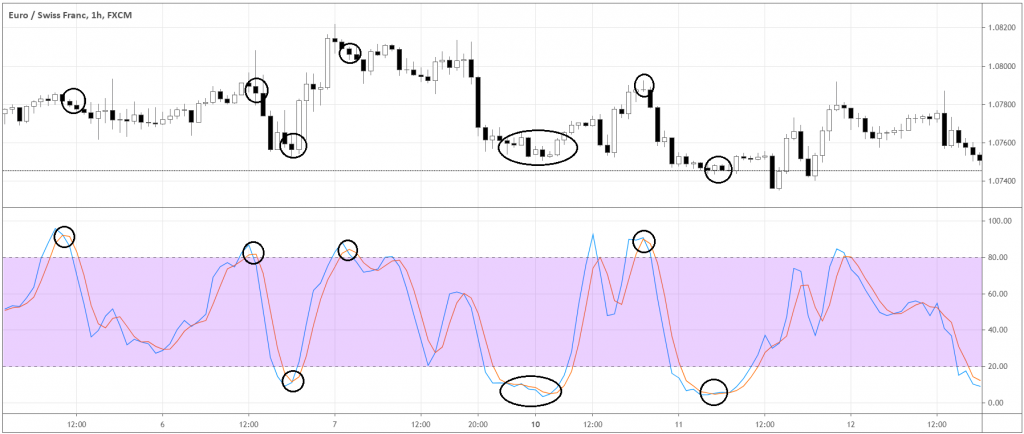
Overbought/Oversold – When %K line of the indicator reaches the value of at least 80 and 20, the market is considered overbought or oversold respectively. Consider having some entry trigger such as a candlestick pattern, a signal from another indicator or a particular time of the trading session to open a position.
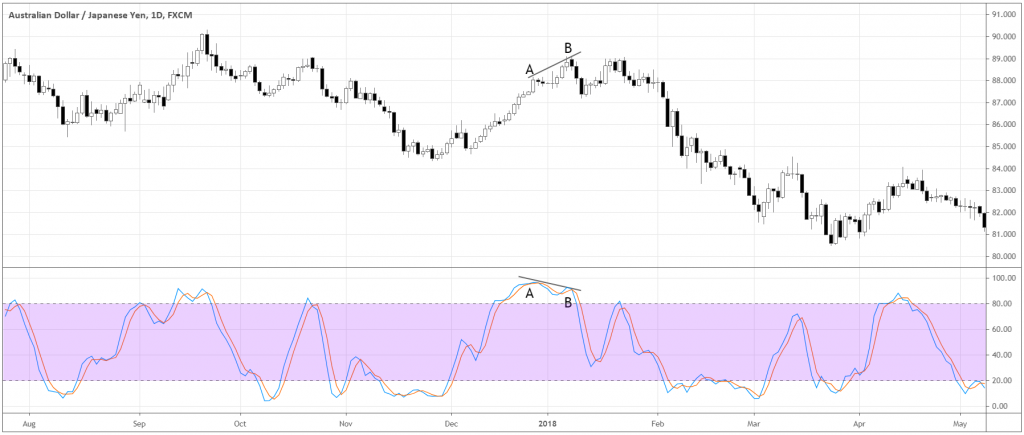
Divergence – When the price makes new highs (points A and B in the chart below), but the swings of the indicator fail to make new highs (A and B in the indicator window), the short-sell signal is generated. The opposite applies for the buy signal.

Crossover – When the fast %K line (the blue line in the chart below) crosses below the slow %D line while the indicator shows an overbought condition, a short-sell signal is generated. Conversely, When the fast %K crosses above the %D while being oversold, the buy signal is generated.

Stochastic belongs to the group of oscillators and most effective in sideways markets. The main difference from other oscillators is its superior ability to generate signals in choppy markets. The logic behind the indicator is the comparison of the recent prices with their range in the past. A trader should use other market analysis tools in conjunction with the indicator to achieve the best trading results.


