The Swenlin Trading Oscillator (STO) is an indicator that helps traders identify support and resistance areas. It was developed by Carl and Erin Swenlin, a father and daughter who are regular commentators in the market. In this report, we will look at what the Swenlin Trading Oscillator (STO) is and how you can use it in the market.
What is the Swenlin Trading Oscillator
STO is a leading indicator that traders use to identify overbought and oversold levels and divergencies in the market. The indicator is primarily calculated by looking at advancing and declining companies in the market. As such, it can only be used when you are trading indices, like the Dow Jones, S&P 500, and the Nasdaq 100.
Unlike other oscillators like the Relative Strength Index and Stochastic, the STO is a relatively unpopular indicator that is not available in the MetaTrader.
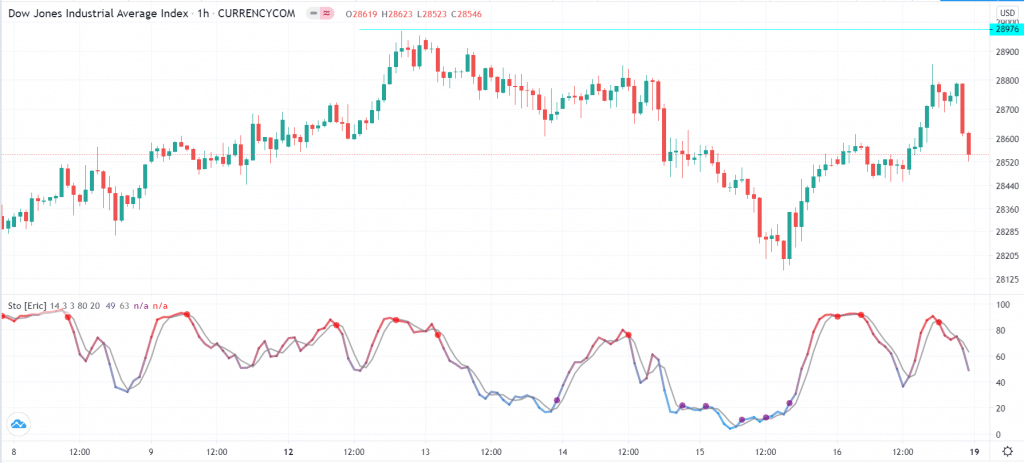
There are two main types of the STOs. The first one, STO-B, looks at the rising and falling prices, while STO-V looks at the rising and falling volume. The hourly chart below shows the STO indicator applied on the Dow Jones Industrial Average (DJIA) chart.
Example of the STO indicator
How the Swenlin Trading Oscillator (STO) is calculated
Calculating the STO is relatively simple. First, you need to identify the period you want to use. In most trading platforms, the default period is usually 5, but you can always tweak it to meet your trading guide. If you are using the price of the index, you should look at all gainers and fallers during this period.
For example, in case of the S&P 500, you need to find out the companies whose share price rose and fell during this period. Second, you should calculate the four-day exponential moving averages of the difference between the gainers and fallers. Finally, you should do the simple moving average (SMA) of the result and multiply it by 1,000. The formular of calculating the STO is shown below:
STO = 5 SMA (4 EMA (((A – D) / (A+D) * 1000))
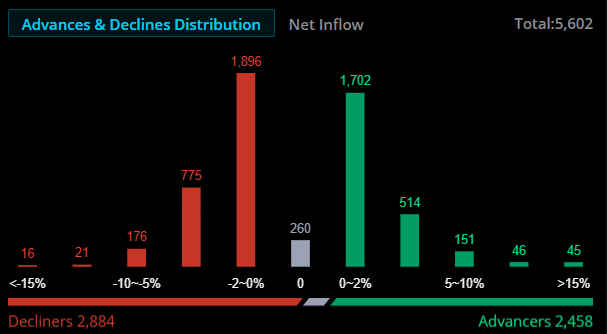
As a result, the STO moves between zero and 100. Also, it is relatively easy to find the advancers and decliners since this data is usually provided by brokers, as shown below.
Advancers and decliners
How to use the STO in trading
As mentioned, the STO indicator is usually more accurate when trading indices like the Dow Jones. However, at times, I have found it useful when trading other financial assets like currencies and commodities.
The first step when using the STO is to determine your chart timeframes. Ideally, if you are a scalper, it won’t make sense to have a daily chart. It will also not make sense to use a 100-day period because you just want the most-recent information. After determining your timeframe, you should select the indicator’s settings and apply the most appropriate.
Using the STO to identify overbought and oversold levels
The most appropriate use of the Swenlin Trading Oscillator (STO) is to identify overbought and oversold positions. An overbought location is when the index is trading at a relatively higher level than its intrinsic level.
For example, if the S&P 500 trades has traded between $2,000 and $2,200 and then it suddenly moves to $2,700, it can be said to be overbought. When using the STO, a move above 80 is usually a sign that the price is getting overbought. Similarly, a move below 20 is usually s sign that the index is getting overbought.
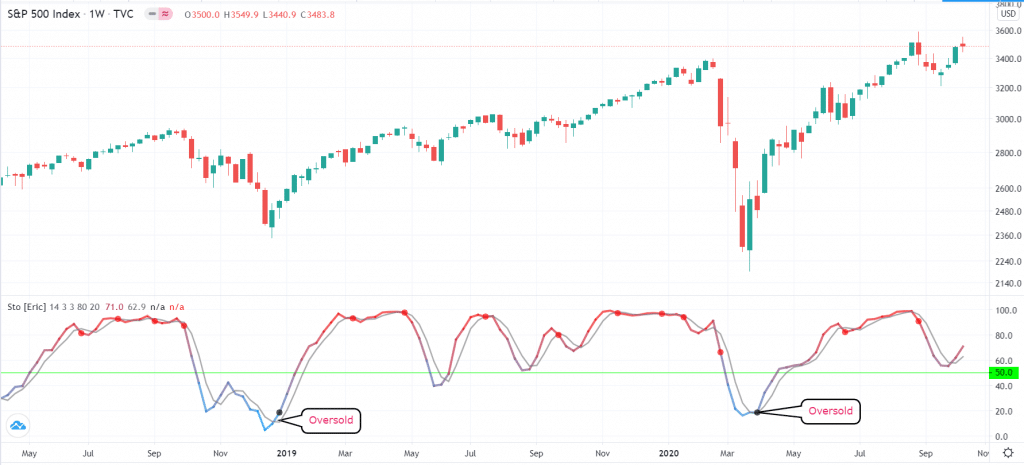
Also, because the STO usually has two lines, the point where they crossover is usually seen as an important signal. For example, as you can see below, a buy signal emerged when the STO indicator is below the neutral level of 50 and when the two lines make a crossover.
STO example 1
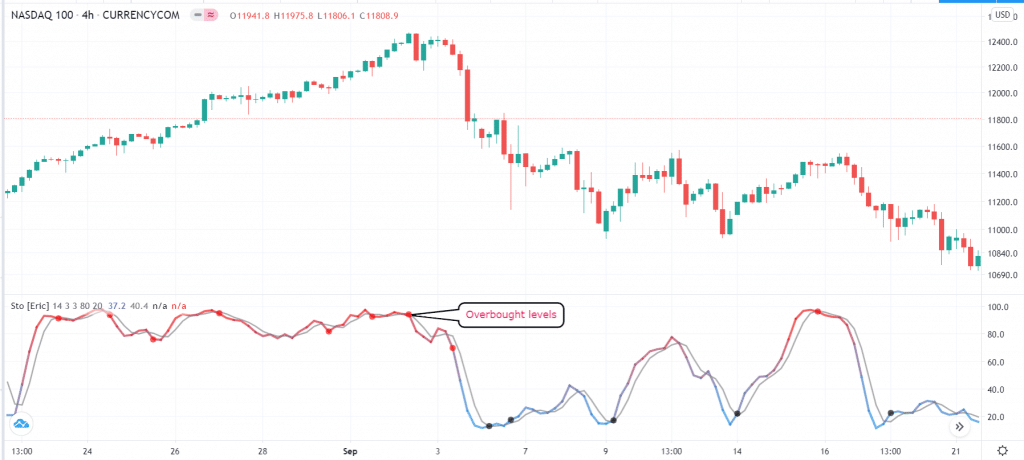
Similarly, short signals tend to emerge when the two lines make a bearish crossover when they are above 50, as shown on the chart below.
STO example 2
Using the STO in following the trend
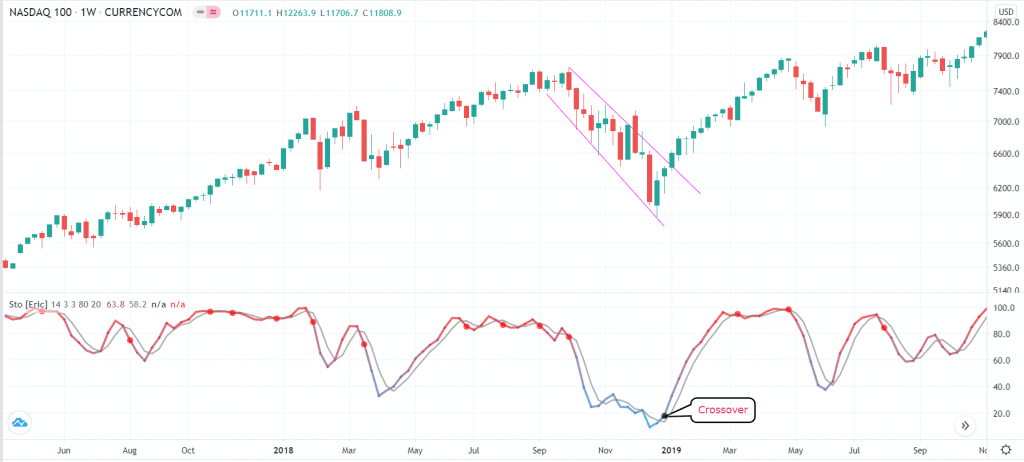
Another approach for using the Swenlin Trading Oscillator (STO) in the market is to following the trend. In trend following, the goal is to buy an asset whose price is rising and short one whose price is falling. In this strategy, your goal will be to buy when the two lines of the asset are rising and short when they are falling.
As a result, the point of exiting the trades is when the two lines make a crossover. In the chart below, we see that the Nasdaq 100 index is in a downward trend that continues until the two Swenlin Trading Oscillators (STOs) made a bullish crossover.
Using the neutral line
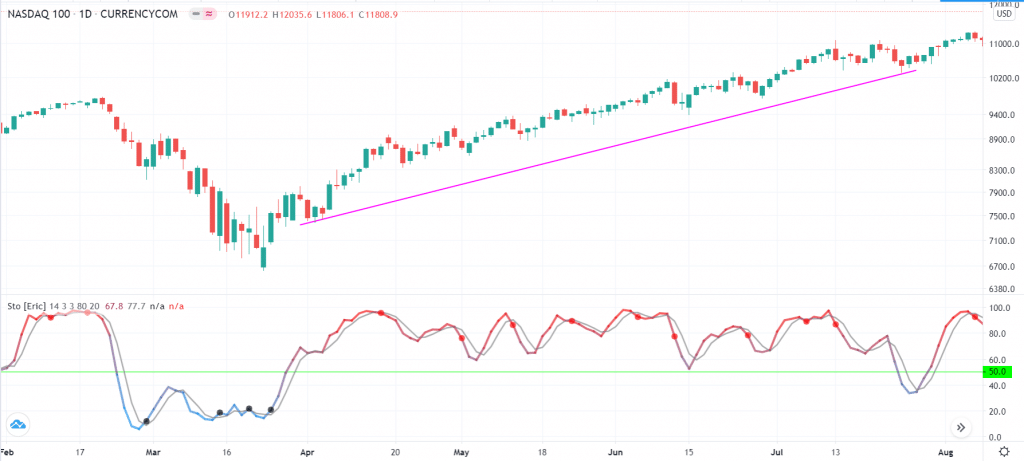
Meanwhile, there are other traders who use the STO indicator to confirm a trend using the neutral line. As mentioned above, this neutral line is usually at 50. Therefore, they continue holding their long positions so long as the two lines are above 50. The idea is that there are more companies in the green, which is a sign that investors are bullish about the market. Obviously, you want to be in the side of the bull market. Similarly, the investors short the price when the price moves below 50. In the chart below, we see that the Nasdaq 100 index continued to rise as the STO indicator remained above the neutral level.
Combining the STO with other indicators
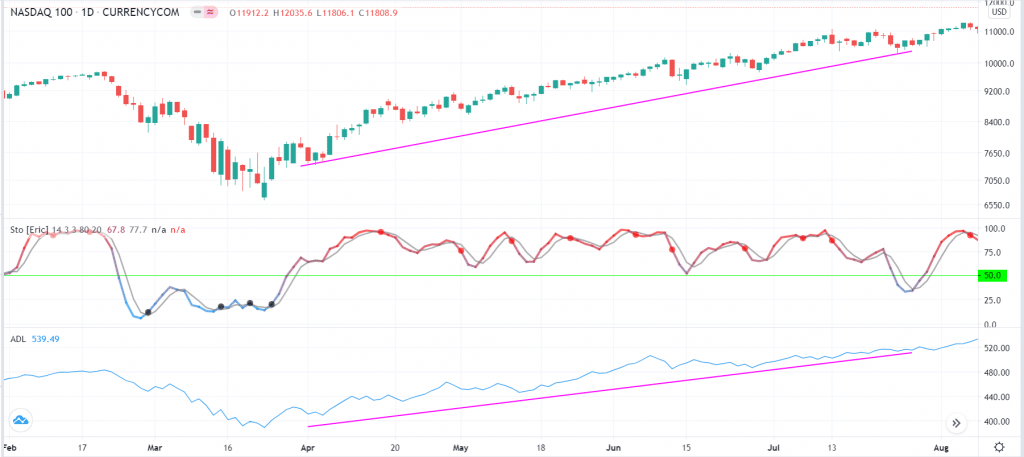
The other approach of using the STO is to combine it with other indicators. The goal of doing this is to confirm a trend. A popular method is to combine it with the advance decline line, which measures the number of companies rising and falling. In the chart below, we can see that the Nasdaq 100 index continued rising while the STO was above 50 and when the advance decline line was rising as well.
Using STO and ADL
Final thoughts
The Swenlin Trading Oscillator (STO) is a relatively new indicator that is gaining popularity with index traders. The indicator is relatively similar to the ADL, with the only difference being that it filters this data by using simple and exponential moving averages. The indicator also has several approaches, such as identifying overbought and oversold levels and confirming trends.


