What is the IG Client Sentiment Indicator?
The client sentiment index or report is a free tool provided by IG, one of the oldest CFD brokers worldwide (established in 1974). IG provides real trading data reflecting the percentage of their active clients net long or net short on a specific instrument and then showing an overall signal (bullish, bearish, or mixed).
This data is updated daily, tracking any changes between both biases. This tool covers some of the most popular forex markets like EURUSD, EURJPY, AUDUSD, USDJPY, and other well-known non-forex markets such as Bitcoin, Ethereum, US crude oil, and the S&P 500.
Only a tiny portion of brokers provide position summary information to the public, making this indicator a fascinating, insightful, and somewhat under-utilized addition to a trader’s toolbox, especially those who observe long-term trends.
What is sentiment?
To understand why this type of indicator can be powerful, one needs to grasp the sentiment concept. In any tradable financial market, the two most common strands of analysis are technical and fundamental.
Sentiment analysis is rarely a topic typically discussed in trading communities, although it does deserve merit. The sentiment is strange because it’s inherently based on the emotion of market participants and crowd psychology, whose attitudes are an accumulation of various fundamental and technical factors.
As a simple representation, when there is a general expectation of a bull market, the sentiment is bullish, positive, or optimistic (the opposite applies for a price decline – bearish, negative, pessimistic).
This statement is the easiest way of concluding sentiment. An immediate distinction of sentiment is viewing it as a contrarian indicator, which is the most important yet unusual.
Why is this sentiment index a contrarian indicator?
The main reason this sentiment indicator is regarded as contrarian stems from the objectives of retail and institutional traders. Retail investors tend to trade against the trend or ‘pick tops and bottoms’, creating a trap for institutional traders or the ‘big boys’ who have enough power to drive price in the opposite direction.
In the image below (figure 2), we see a prime example of this phenomenon.
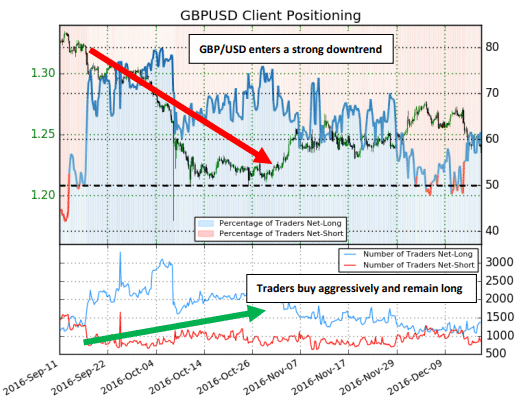
Also, retail traders often buy right at market tops or sell right at market bottoms, without realizing this could be in strong support or resistance zones. Since these areas feel ‘safe,’ this can create another trap for the ‘big boys’ to take price the other way.
How to read IG client sentiment
Changes to the IG Client Sentiment Indicator data are updated once every day, typically between 09h00 to 11h00 UTC.
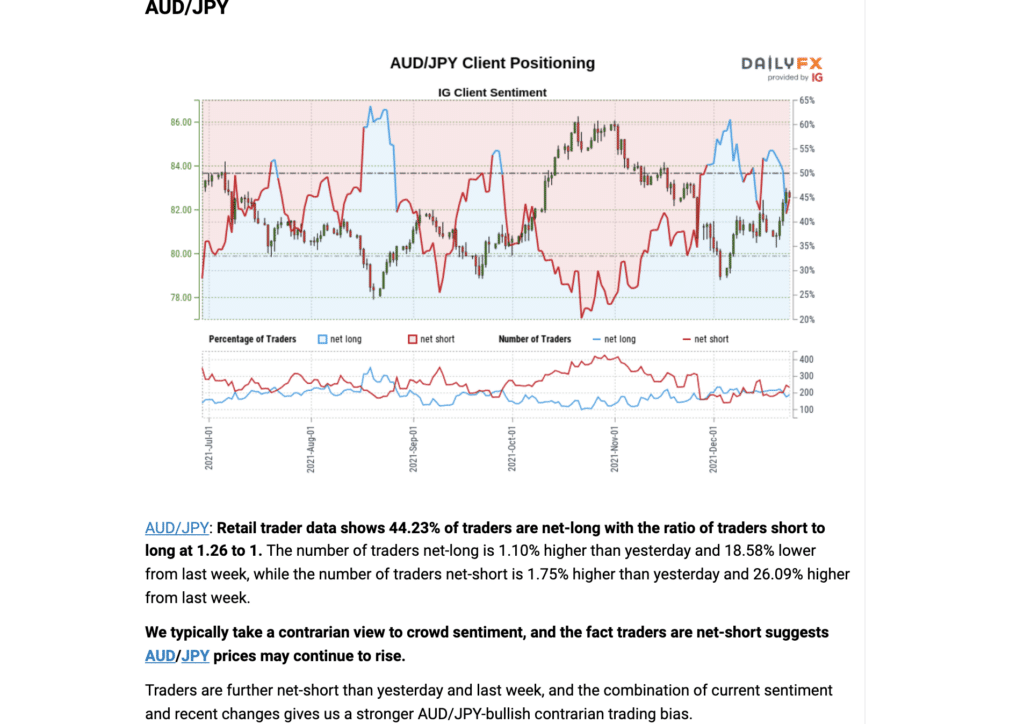
Of course, the most crucial part is the resulting bias: bullish, bearish, or mixed. When bullish, you should be looking for buying opportunities; when bearish, you should be looking for selling opportunities.
If the bias is mixed, you may want to not look for any positions on that particular security until things change.
How reliable is IG client sentiment?
Overall, the index is quite accurate, primarily in long-term trends. This means the tool might not be advantageous for scalpers and day traders as updates to IG client sentiment data don’t occur in real-time.
As with any concept, sentiment can frequently change even throughout the day. The other drawback is IG client sentiment data is only limited to the number of clients trading with IG (reportedly around half a million) instead of the entire forex market.
The typical school of thought for making trading decisions is using a combination of technical and fundamental analysis. While these methodologies are helpful, sentiment analysis is often overlooked yet could be a valuable addition.
Unlike the previously mentioned analysis strands, sentiment is based on real, actionable data. Yet, as with any tool, traders should use the IG Client Sentiment Indicator as a confirmation layer with other set-up triggers to form a solid trading idea.
How to interpret the IG Client Sentiment Indicator
Any sentiment indicator is a graphic or numeric depiction of the percentage of traders currently in long (buy) positions against those in short (sell) ones. In IG’s case, the broker provides a general summary and a more detailed report on the net long and net short positions of the relevant markets (figure 3).
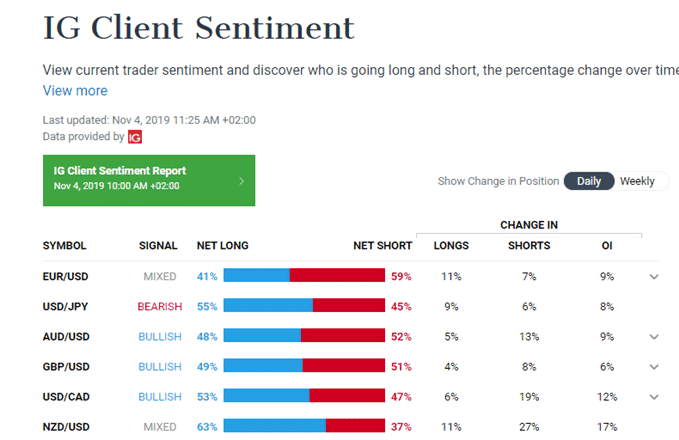
In the image above, we can see the overview.
- Net long and net short (the percentage of traders currently long versus those currently short).
- Signal (this can either be bearish, bullish or mixed depending on the discrepancies between buyers and sellers). The sentiment is bullish if there are noticeably more net short positions than net long ones. If there are tremendously more net long positions than net short ones, the sentiment is bearish.
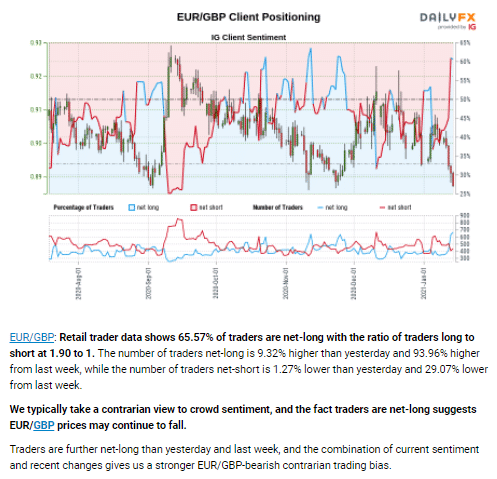
Furthermore, for each market, IG provides a better graphical representation (figure 4) and daily-updated reports to ensure traders can view the actual price movement against the sentiment data.
They also provide the brief results of the data, changes from the previous days and weeks, and what the eventual directional bias should be (figure 4).
How to get IG client sentiment data API
IG provides two APIs (application program interfaces), the web API (available for retail traders) and FIX API (available for institutional traders). To get the first API, you need to go onto the IG Labs website, create an account, generate an API key and connect this AP using the broker’s Excel app.
Among other functions like reviewing trade history and maintaining watchlists, this API allows users to analyze client sentiment information more deeply than usual. Of course, you will need pretty good coding experience to use such interfaces effectively.
Methods of using the IG Client Sentiment Indicator
This section is critical and will provide practical and actionable tips for implementing this indicator. Depending on the trader, this tool can be the first or last point of reference.
Short-term investors like scalpers and day traders are unlikely to benefit from this tool. Although anyone can view changes daily, it usually takes time to see the actual effect of these results. For long-term trends, we can clearly observe sentiment.
Regardless, one still needs to perform their technical analysis aside from observing the sentiment data. Any sentiment indicator shouldn’t be a primary motivation for taking a position but could act as a confirmation and an observational tool.
We also should not attempt to ‘time the market’ with this index. Broadly speaking, traders can use the IG Client Sentiment Indicator in two ways.
Trend confirmation and continuation
One powerful method of using this indicator is to confirm the extent of an existing trend. Let’s look at the EURUSD sentiment report below (figure 5).
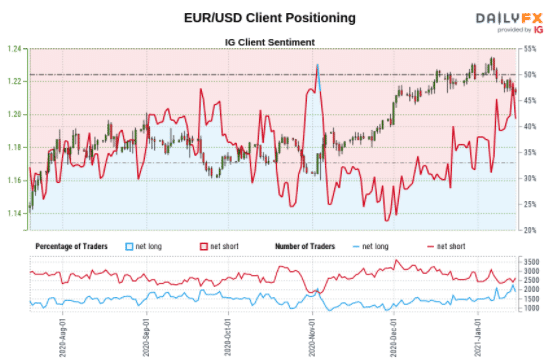
Ultimately, to confirm the likelihood of a trend continuing, one needs to look for extremes between net long and net short positions. Since August 2020, we can see the red line (representing net short) was wide away from the blue line (representing net long).
Traders should consider bullish directional bias until there is a cross between the two. We can observe the lines spreading apart at various intervals by comparing the number of net short and net long clients on the axis. As the red line rose (suggesting more sellers), the trend continued its ascension.
Trend changes
Similar to trend changes, we could consider looking at the index when the extremes change. Let us assume, according to our technical analysis, a particular market is at a critical resistance level on an uptrend.
We would need to see an overwhelming number of net long clients against net short ones to confirm the reversal. This idea feeds into the narrative that aside from retail traders going against the trend, they also tend to buy when a market is too ‘expensive’ or sell when it’s too ‘cheap.’
Best strategies to trade IG client sentiment
Let’s explore a few specific strategies incorporating IG client sentiment data.
Trend line break with 200-day moving average
In the image below (figure 6), IG describes the changes between buyers and sellers on EURJPY.
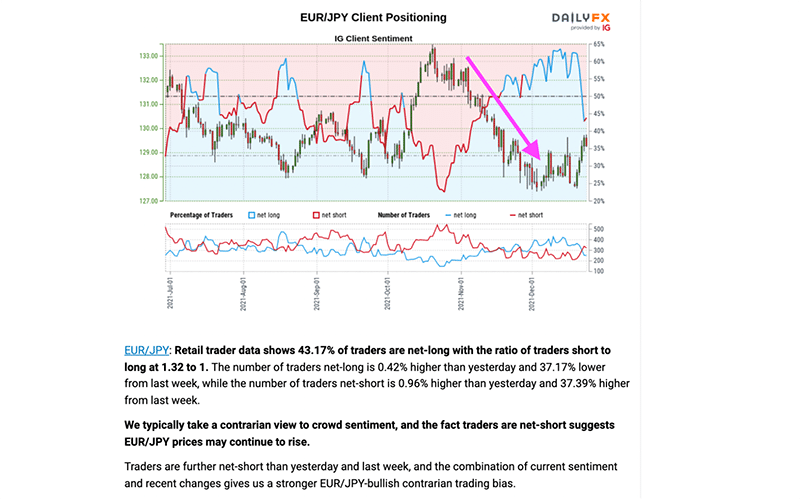
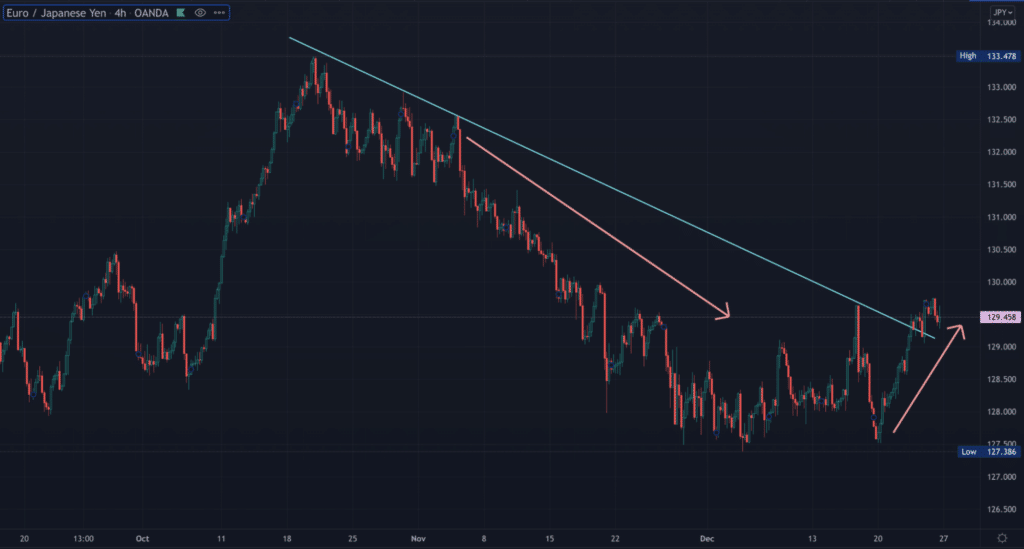
This pair was in a sustained downtrend for about two months. IG mentioned in their report for EURJPY that the number of net-short clients was 37.39% higher than the last week, while the number of net-long clients was 37.17% lower within the same period.
As confirmed by the report, the sentiment was likely to become bullish with more sell than buy orders. Moreover, we’ve drawn a trend line and plotted a 200-day exponential moving average in the chart below.
With this strategy, one waits for the price to break the trend line and trade above the 200 EMA. Along with IG client sentiment data, this would have given extra confirmation to look for buying opportunities going forward.
RSI divergence with a trend line break
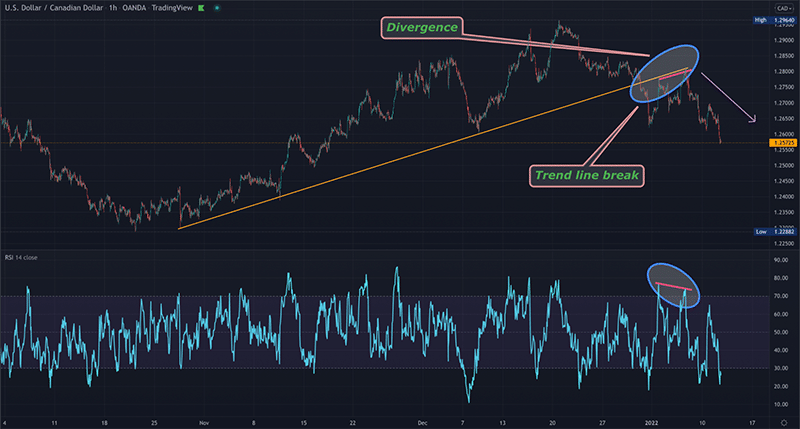
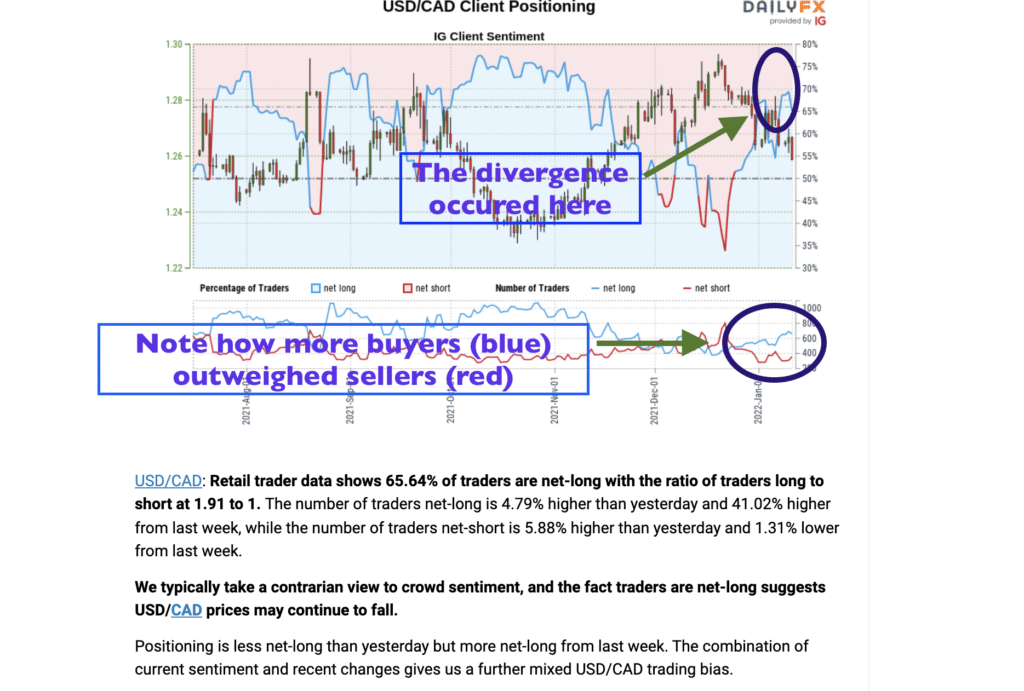
This example is another scenario of a reversal using this index. In the 1HR USDCAD chart below (figure 8 and 9), we see the market broke the trendline and then reverted to test the ‘back side’ of it.
An RSI divergence occurred, which would have been the second reversal trigger for this position. At the same time, IG client sentiment data showed an increasing number of buyers who might have believed the trend was still to the upside.
As the net-longs outweighed, price began moving in the opposite direction.
Pros and cons of using the IG Client Sentiment Indicator
Pros
- This indicator is entirely free of charge. This tool can prove beneficial for the level of detail in terms of data representation.
- Traders gain an insight into the actual percentage of real clients buying or selling in a particular market rather than imagined or hypothetical figures.
- This sentiment indicator is a lot easier to read and comprehend than the more intricate Commitment of Traders (CoT) report.
- We could regard such a sentiment indicator as leading since it often changes on a frequent basis along with actual client positions.
Cons
- Although the CoT report can be harder to digest, at least 250,000 clients are covered, making the data microcosmic in the grand scheme of the larger forex markets. The CoT shows the positions of institutional traders who have more significance than retail clients.
Conclusion
The sentiment index provided by IG is an excellent service to help us understand the forex markets uniquely. These are the key takeaways we should note:
- Sentiment analysis is best for swing and position size traders who look at long-term trends.
- We cannot use the index as a primary indicator or a timing one. It merely helps reflect a directional bias, which we may consider aligning with.
- For traders interested in sentiment, the CoT report may be a better option as it accounts for the orders of institutional traders instead of retail ones.
- Although we could think of the index as a leading indicator, as with any tool, traders cannot use it in isolation.

