Forex traders are always looking to grow their accounts, for which they need to identify trends and find suitable trading setups within them. It can be difficult to deal with the trends sometimes, and it certainly helps to have the best indicators at your disposal. This way, you can tell if a trend exists while also gauging the strength of the momentum.
What are Forex trend indicators?
Forex trend indicators are powerful tools that can be used for making trade entries and carrying out trend and market analysis. Using these indicators, you can get indications of consolidation phases, downtrends, and uptrends. You can use different indicator types based on your trading time frame and strategy.
These indicators can be easily interpreted and set up, and you can use them to analyze more than one pair across multiple time frames. This way, you get more in terms of risk/reward ratio and can edge out your competitors.
How to use price action?
Price action provides you with vital information about the market where you plan to place your trade. This includes information related to stop losses, the moment when new traders make their entries, etc. In this regard, you should remember that a bearish trend is characterized by higher lows and highs, a bullish trend involves lower lows and highs, and the lows and highs contain a range between them.
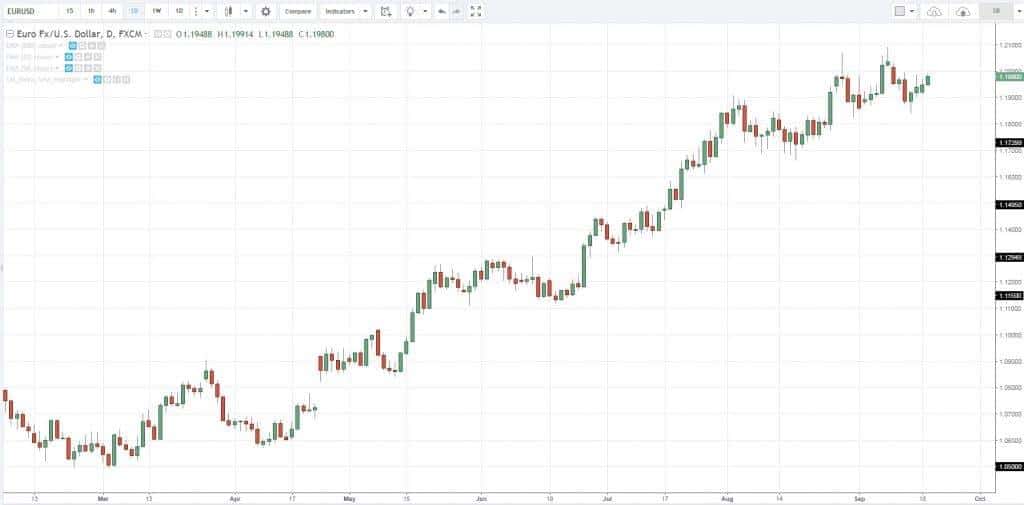
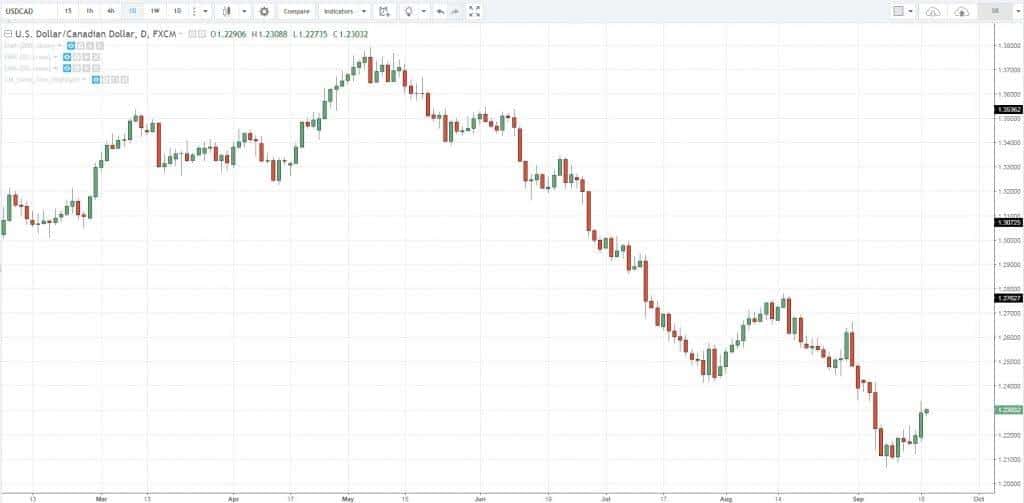
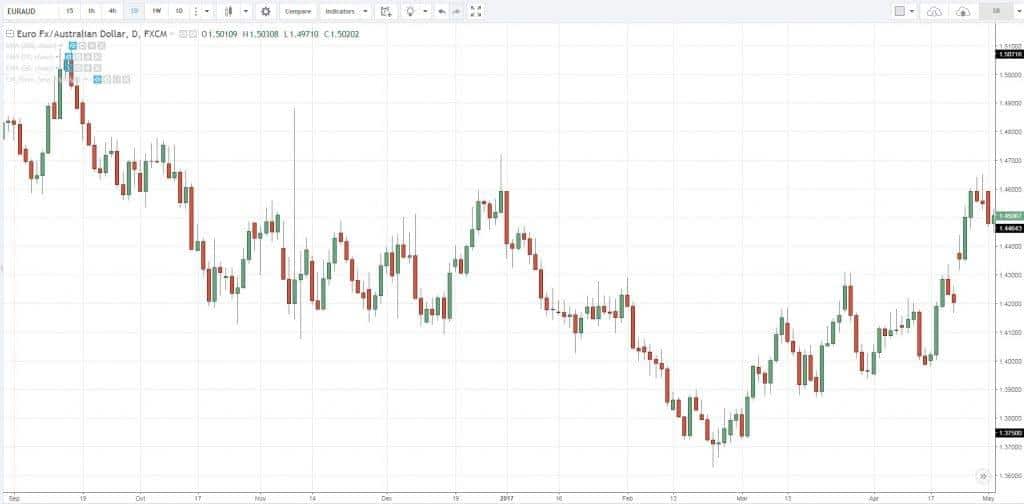
The three figures above illustrate uptrend, downtrend, and range, respectively. When the candlesticks are erratic, it may not be easy to determine the nature of the trend and the direction it is moving in.
Trend trading using the moving average
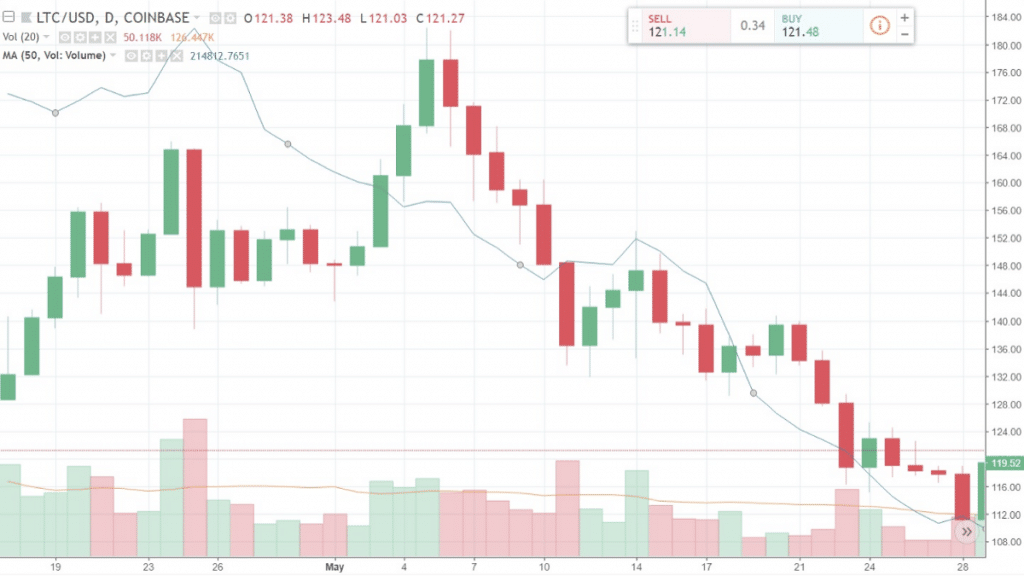
Most Forex traders prefer Moving Averages since they smooth down the price fluctuations in the market, thus helping you monitor and keep track of the trends. This indicator lets you locate the major trends by smoothening the volatile shifts in price. As the market rises and falls, you can use the moving average indicator to create dynamic zones of support and resistance.
The effectiveness of this indicator depends largely on the time frame. You can apply the MA length to a chart time frame as per your preferred trading time frame. The lookback period length that’s chosen by you also determines the efficacy of the MA.
Moving Average depicts the average price for a specific time period; for instance, a 12-day MA will depict the average prices for the previous 12 days. With fluctuating prices, the moving average keeps rising and falling. This indicator assists you in identifying the direction of the trend.
The stochastic oscillator
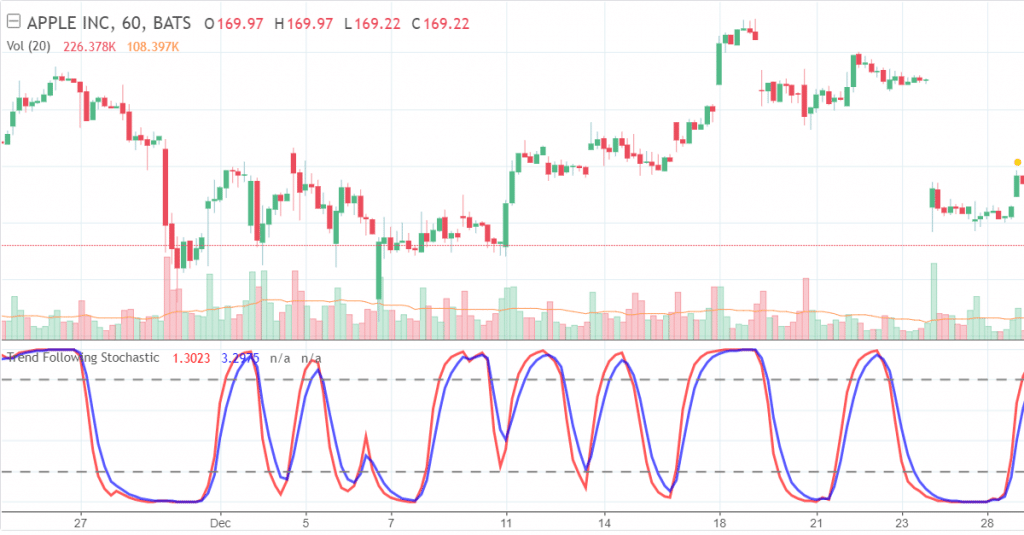
Using the stochastic oscillator, you get an idea about momentum and how strong the trend is. Price shifts can be analyzed using this indicator to know how strongly and swiftly the price fluctuates. It also tells you where the trend might end.
This indicator computes the relation between an asset’s closing price and its price range for a specified time period. If its value is high, it tells you that the price closed near the range’s peak for a specific time period or a certain number of candlesticks. On the other hand, when the stochastic value is low, you know that the downside momentum is quite strong.
Here are some common strategies where the stochastic indicator is used:
- Breakout trading: You get the indication of a new trend forming when the stochastic accelerates in a single direction all of a sudden, along with the widening of the bands. A sideways range breakout can also be spotted.
- Strong trends: When the indicator is in the overbought/oversold zone, it is advisable to hold your positions and not place any counter-trend trades.
- Trend reversals: Upon changing the direction and leaving the overbought/oversold zones, the stochastic indicator can forecast a trend reversal. For example, while looking for downtrend reversal, you must make sure the green line goes above the red one and exits the oversold/overbought zone.
- Trend following: Provided the stochastic is unidirectional, you can spot a trend using this indicator.
- Divergences: Stochastic divergence is a vital signal that depicts probable reversals in the trend or the conclusion of the same.
The stochastic oscillator can also be combined with other tools for improving the trading quality and generating valid signals. These include moving averages, trendlines, and price formations.
Using MACD for trend trading
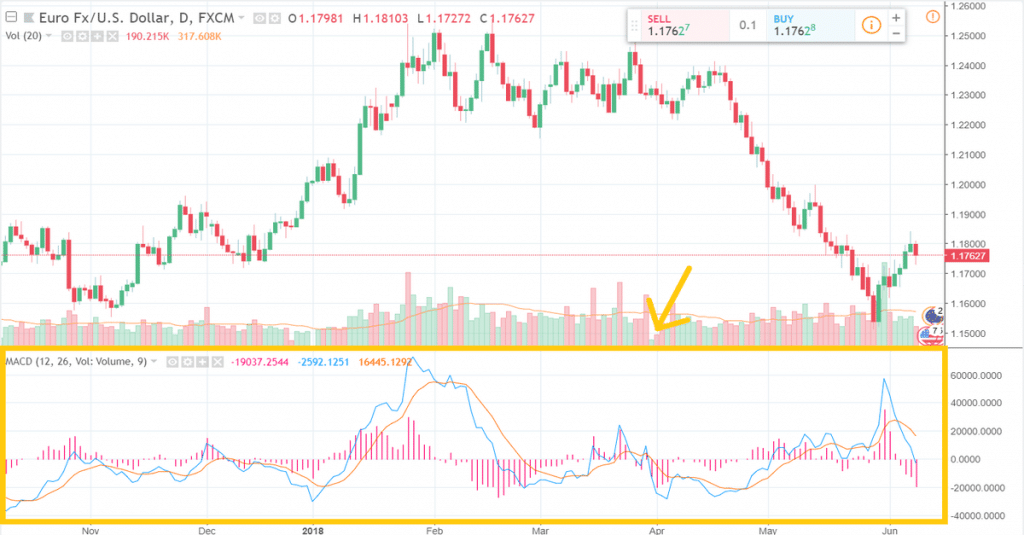
One of the most widely used Forex trend indicators is the Moving Average Convergence Divergence or MACD. Traders can use this indicator to get the indication of a strong momentum or trend materializing. This is done by outlining the relationship between the values of the two MAs.
The indicators used for Forex trading can be classified as confirming, leading, and lagging indicators. The MACD indicator predicts future price shifts by using the difference between short and long-term trends. The two moving averages making up the MACD have different speeds, so one of them would respond faster to a price change.
This indicator swings above and below the baselines, thus highlighting both trend direction and momentum through divergence and convergence. As the faster line outruns the slower one, you start getting the signal of a new trend formation.
Since many people are participating in the Forex market, both the volatility and liquidity are extremely high. In the case of stocks, although volatility exists and big moves are possible, the trading volume and liquidity decreases with departure from major stocks. This is why Moving Average Convergence Divergence is extremely useful for pointing out trends in the Forex market.
Conclusion
Thus, you came to know about some of the most popular Forex trade indicators. When you manage to ride the trend efficiently, you enhance your chances of making gains. Remember, you cannot get good results by only using one indicator, so you must try out all of them to see which suits your trading strategy best.


