A golden cross refers to a situation where the 50-day moving average crosses the 200-day moving average as the price rises. On the other hand, a death cross is when 200-day MA crosses the 50-day MA during a downtrend. In this article, we will look at how to use the golden and death crosses in the forex market.
MA types – the key to understanding the cross patterns
A good explanation of a golden and death cross needs to start with a closer look at the moving averages. For starters, MAs are some of the most popular technical indicators in the forex market. In fact, they have been used as the foundation of several indicators like the Bollinger Bands, Envelopes, the moving average convergence and divergence (MACD), and the variable index dynamic average.
MAs attempt to identify the ideal price of an asset in a certain duration. There are several types of them:
- Simple moving average (SMA) – This type of average is created by calculating the average price of an asset in a specific number of periods.
- Exponential moving averages (EMA) – The EMA attempts to reduce the lag of an asset by putting more emphasis on the recent prices. It does this by adding a multiplier that provides this weight.
- Weighted moving average (WMA) – The WMA also attempts to reduce the lag in the SMA by applying more weight to the most recent data while simultaneously reducing the weight of the old data.
- Smoothed moving average (SMMA) – The SMMA is similar to the EMA only in the fact that it applies for a longer period.
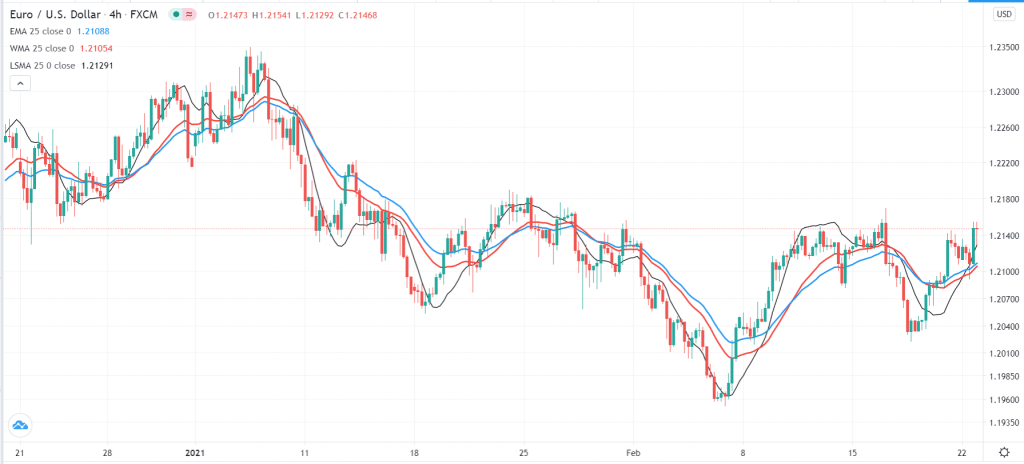
There are other types of moving averages, including the least square MA, Hull MA, and the Arnaud Legoux MA. The chart below shows the EUR/USD with the 25-day EMA, 25-day WMA, and 25-day Least squares MA.
EUR/USD with EMAs
Benefitting from forex with MAs
There are a variety of methods of using moving averages in forex. Some use the MAs to find out whether a currency pair is overvalued or undervalued. For example, if the EUR/USD is trading at 1.2500 and the SMA is at 1.2400, it could mean that the pair is overvalued.
A good example of this is what is happening during the coronavirus pandemic. Health officials tend to get worried when the number of cases is significantly above the moving average.
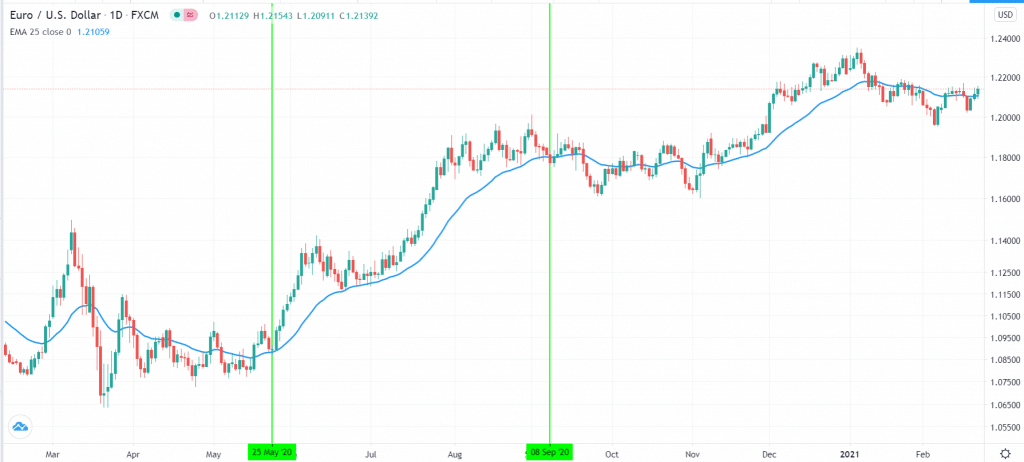
Another way of using moving average is in trend trading. When a currency pair is in a trend, you can use a moving average to identify the danger zone. For example, in the EUR/USD chart below, the uptrend was intact when the price was above the 25-day moving average.
EMA in a trend
Third, another popular approach of using moving average is to identify crossovers. Ideally, buying signals emerge when two moving averages make a crossover.
In search of the golden cross in forex
As mentioned above, a golden cross refers to a situation where the 200-day and 50-day moving averages cross over.
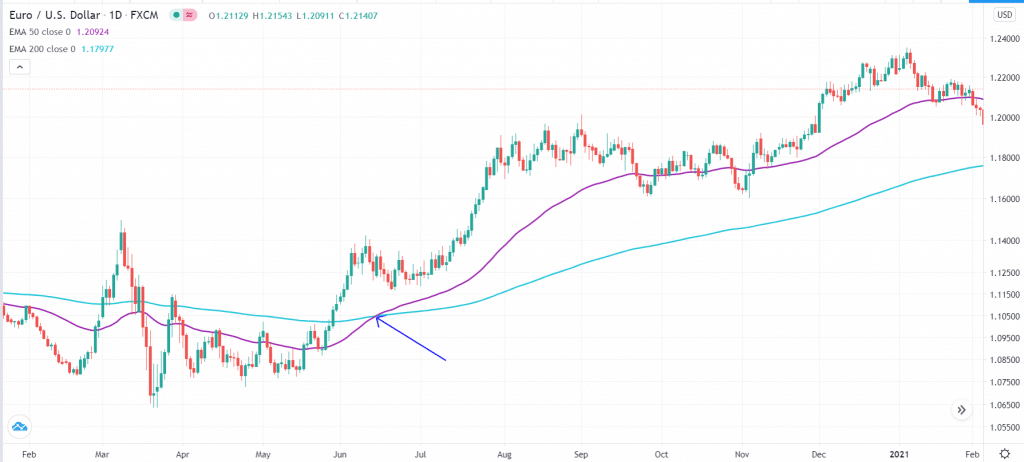
The idea behind it is relatively simple. After a sharp decline, a currency pair will start rising. As it does this, it will cross the 50-day moving average first in a sign that bulls are prevailing. However, some traders will continue wondering whether the uptrend has really started.
Finally, the uptrend will be confirmed if the price manages to move above the 200-day moving average. When this happens, more buyers will start to come in and push the price higher. A good example of this is in the EUR/USD chart below. As you can see, the uptrend gained steam when the two averages crossed over.
Golden cross moving average
A common question among many traders is about the right type of moving average to use. While the most commonly used type of MA used is the SMA, some analysts advocate using the EMA or WMA because they have less lag.
Also, it is worth noting that the golden cross, as defined above, has significant limitations. For example, for a day trader, the 200-day and 50-day moving averages can be a bit irrelevant. That’s because day traders are mostly focused on short-term durations because their strategy ensures that all trades are closed by the end of the day. Therefore, waiting for the 200-day and 50-day MAs can be relatively ineffective.
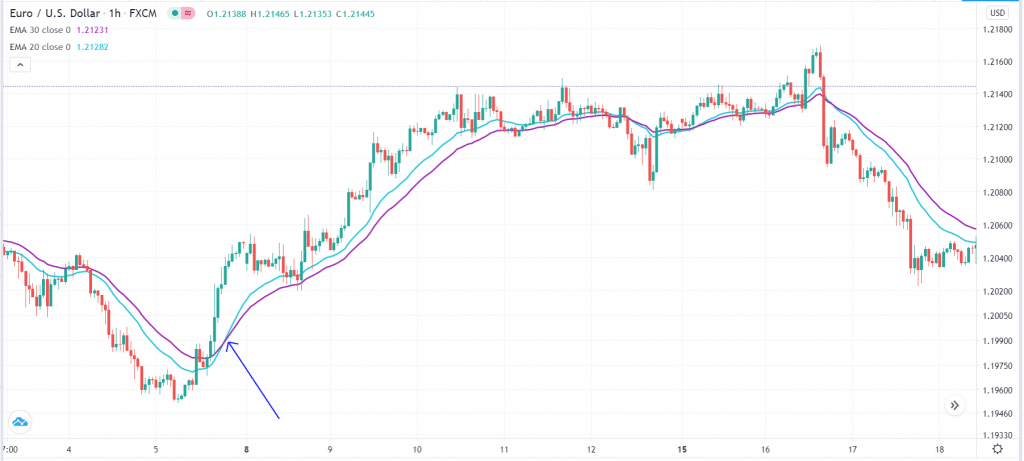
To solve this, some traders have a tendency to reduce this period. For example, instead of using the 200-day and 50-day EMA, they use a combination of 30-day and 20-day. For example, as shown below, such a relatively narrow combination can produce better signals.
Alternative to golden cross
Death cross identification in forex
A death cross in forex is the exact opposite of a golden cross. It refers to a situation where the 200-day moving average and the 50-day MA have a bearish crossover. It simply means that the price started falling and moved past the 50-day MA. This, in turn, attracted some short sellers. As it dropped, the price moved below the 200-day MA, which attracted more short sellers.
Death cross example
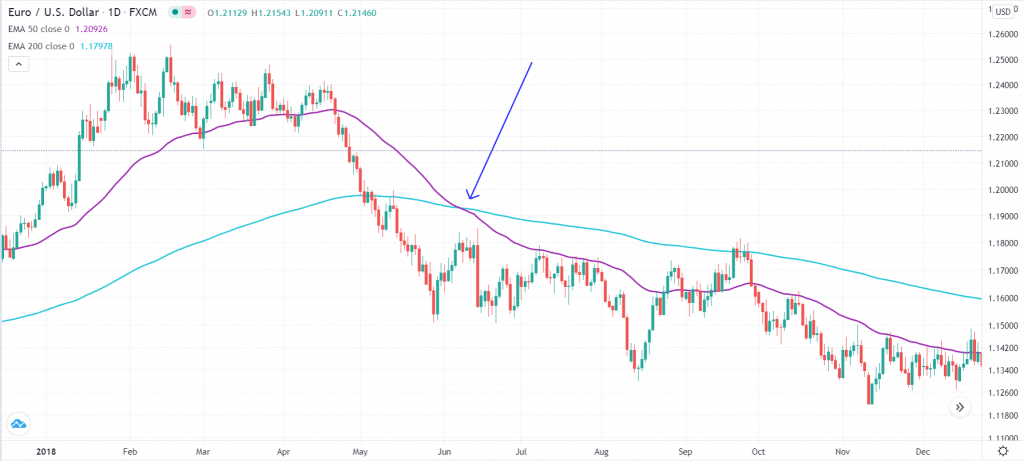
The biggest challenge for the death cross is that the 200-day and 50-day moving averages are relatively ineffective to many traders. Also, when you use these periods, the crosses become significantly rare. As such, you can miss some important trading opportunities.
Therefore, the best approach is to try and find some shorter durations that work well. Personally, I prefer using 10-day and 30-day exponential moving averages.
Final thoughts
Golden and death crosses are important concepts in the financial market. They refer to a situation where a 50-day and 200-day moving averages cross. However, in reality, these crosses are relatively rare, and, thus, not useful to many traders. Instead, we recommend that you use a demo account to find out the best periods that work. Also, you should use the crosses together with other technical indicators like the Relative Strength Index (RSI) and the MACD.

