
Trend trading is a highly effective trading strategy akin to investing that allows traders to squeeze significant profits in the capital markets. The strategy entails identifying market momentum, opening a position in the direction of the momentum, and staying with the trend until price reverses.

Trend trading is often adopted by traders who prefer position trading or swing trading. Given that underlying trends last for long, traders make open trades in the direction of the trend and allow them to run for weeks or even months ignoring day-to-day fluctuations.
How to Identify A Trend
To make a fortune while trend trading, it is essential to identify the underlying trend, likely to last for weeks or even months. Likewise, it is crucial to exit the market as soon as the trend reverses, and the prices start to shift in the opposite direction.
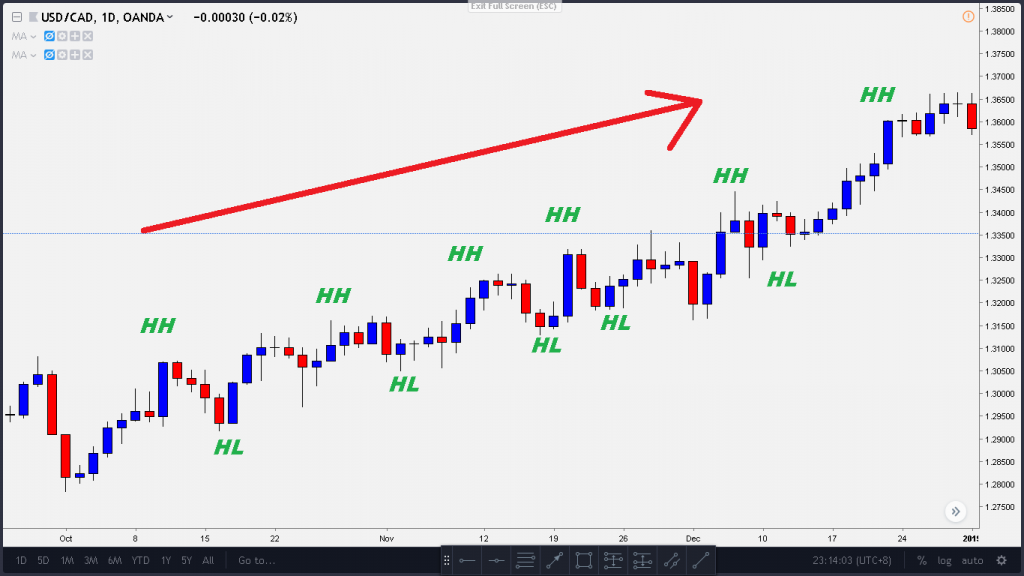
Broadly, there are three types of trends. An uptrend is synonymous with price moving up, occasionally pulling back to a support level that acts as support levels from where buyers come in and continue pushing price up. In this case, the price makes higher highs and higher lows, as shown below.
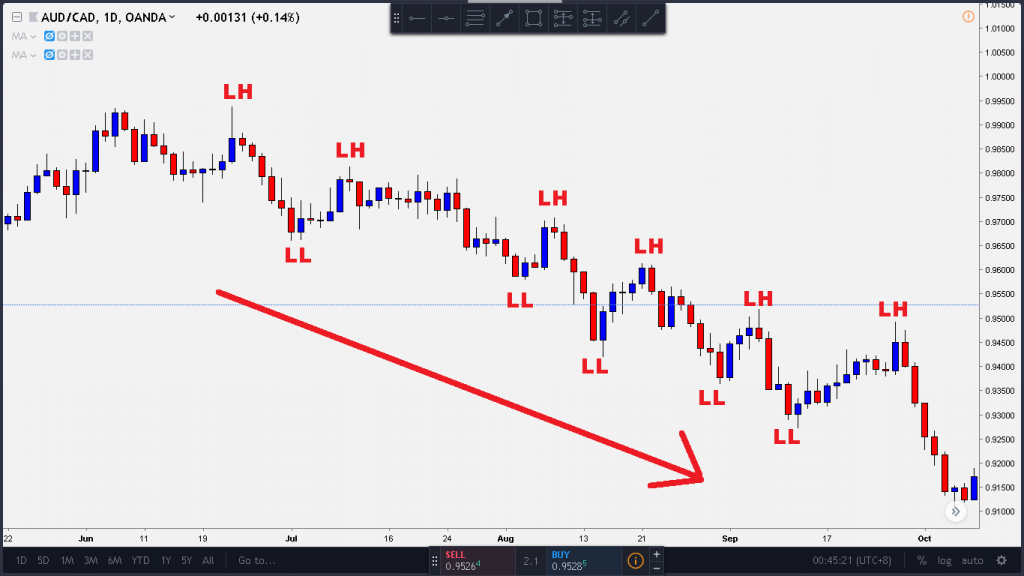
On the other hand, a downtrend sees price moving lower with any slight pullback attracting additional selling pressure, resulting in price making new lows. Conversely, a downtrend is synonymous with lower lows and lower highs.
Whenever price is not registering any new high points or lower points, it is said to be sideways. In this case, price is range-bound, opting to oscillate between a given high, which acts as resistance and low acting as support.
Following the Trend with Moving Averages
Moving averages are crucial technical analysis tools often used to identify trends in the market. The indicator is simply the average price of an asset over a given time and printed on a chart as a single line. Moving average moves up in case of an uptrend, down in a downtrend, and remains flat whenever the market moves sideways.
However, moving averages are lagging indicators as they only tell what happened, therefore, providing insights on what to expect in terms of price action. Whenever price is above a given moving average, then the market is said to be trending upwards. Similarly, whenever the price is below a moving average, price is said to be trending downwards.
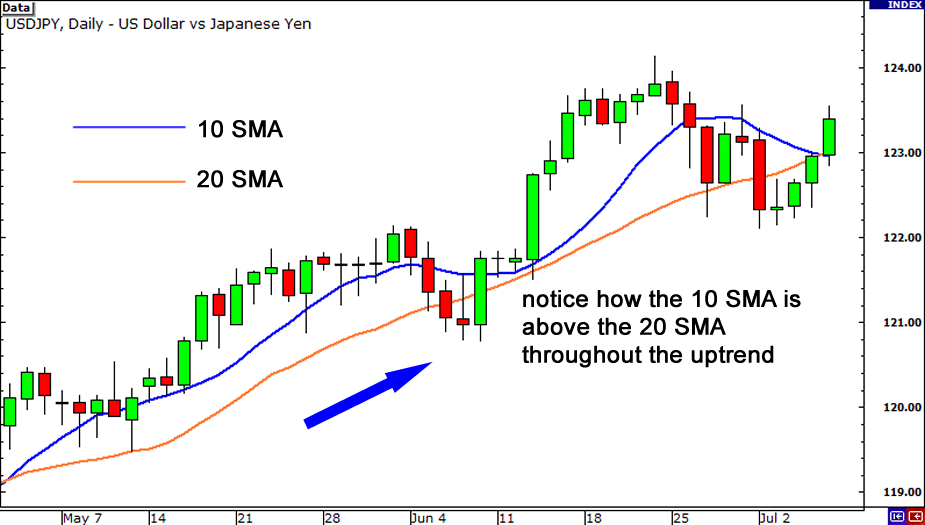
Traders often use two moving averages to identify changes in the direction of the market. A fast and slow-moving average is commonly used in this case. Whenever two moving averages cross each other, the same signifies a change in market momentum.
Top Trend Trading Strategies
Trend Trading: Using a Channel
Channels are effective trend trading tools when it comes to technical analysis. Channels provide a great way of visualizing the trend and provide insights on ideal entry and exit points. Most trading platforms come with a tool that allows the interconnection of higher highs and lower highs in case of an uptrend and lower lows and higher lows in case of a downtrend.
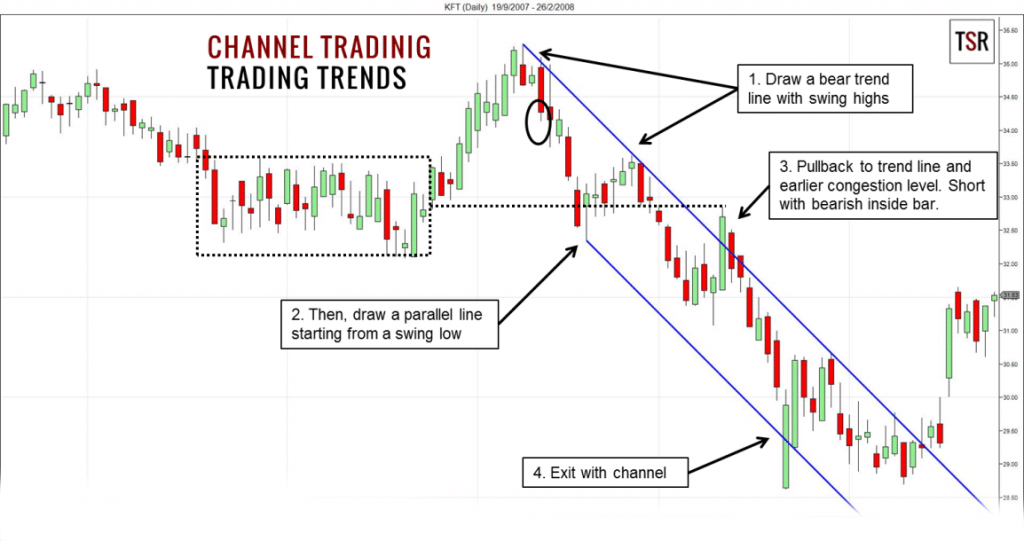
The channel above shows how price made lower lows and lower highs in an excellent channel.A trader would have entered a sell position whenever price rallied and touched higher points on the circuit. Likewise, one would have entered a buy position whenever price touched the lowest point on the channel.
While trend trading using channels, it is vital to enter positions in the direction of the moving average. For instance, when the price is below a given moving average, say 200EMA, for optimum returns at low risk, it would be wise to focus on sell positions whenever price rallies and touches a high point in the channel.
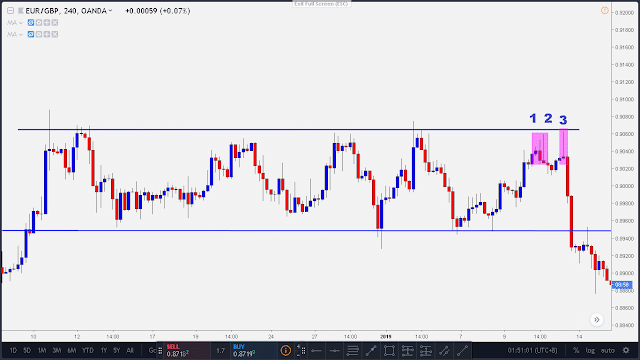
Trend Trading: Using Bull and Bear Flags
Bull and bear flags are simply candlestick patterns that appear depending on market momentum. A bull flag appears whenever the price is trending up, above a given moving average, and suddenly pulls back and starts oscillating in a channel resulting in a flag pattern.
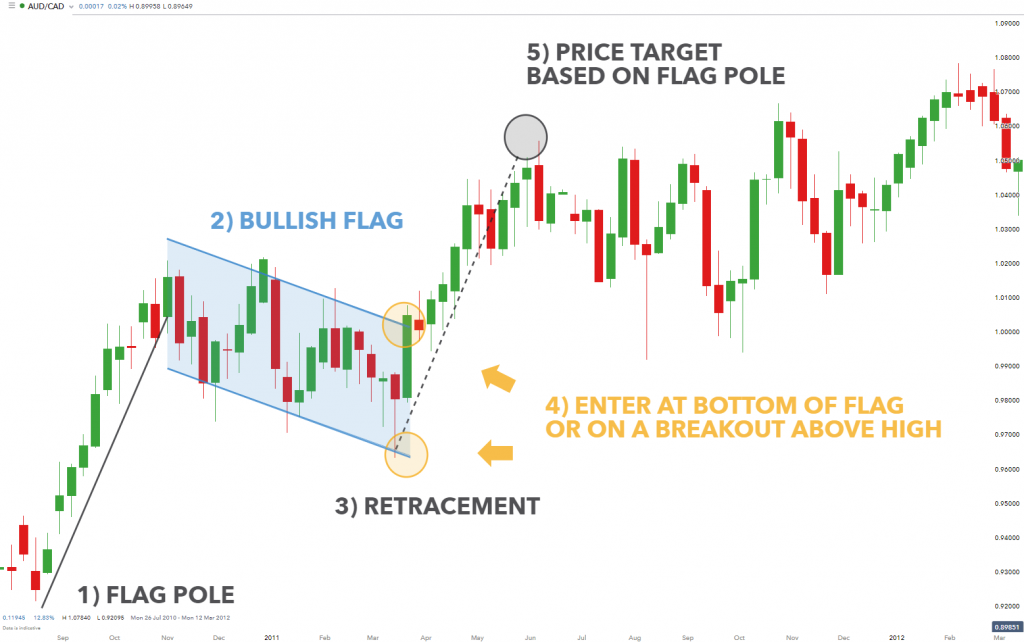
What happens is that price would often oscillate in the channel, break out of the channel and continue moving up in the long-term trend. In this case, it is ideal for entering long positions at the tail end of the channel or whenever price breaks out of the channel and starts moving up.
Bear flags, on the other hand, occur whenever the price is trending lower. After moving lower for an extended period, the cost would often pull back, appearing to have reversed.
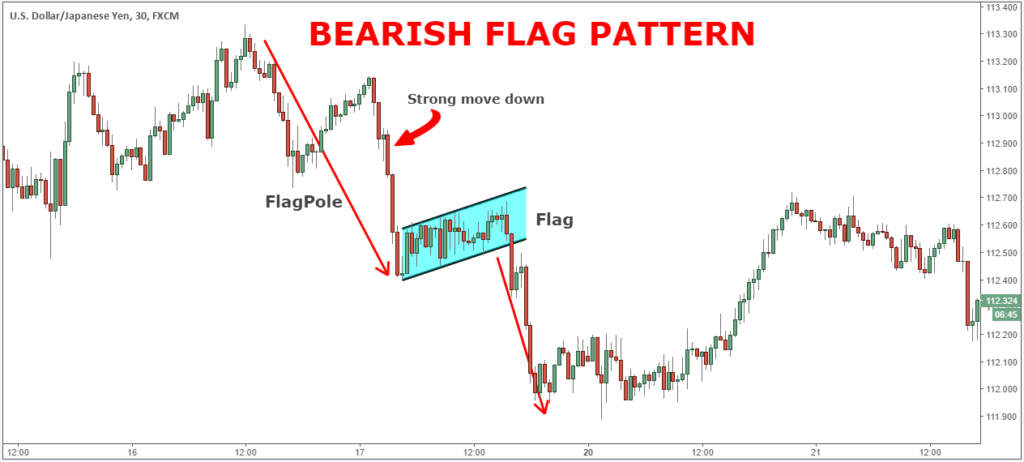
However, the price would end oscillating in a channel resulting in higher highs, and lower highs in a flag pattern after sometime price would break out of the channel and start moving lower, presenting an opportunity to profit on further downside action.
Trend Trading: Using Moving Averages
Moving averages are at the heart of trend trading when it comes to technical analysis. Moving average crossover is a useful trend trading strategy that allows traders to take advantage whenever new trends occur.
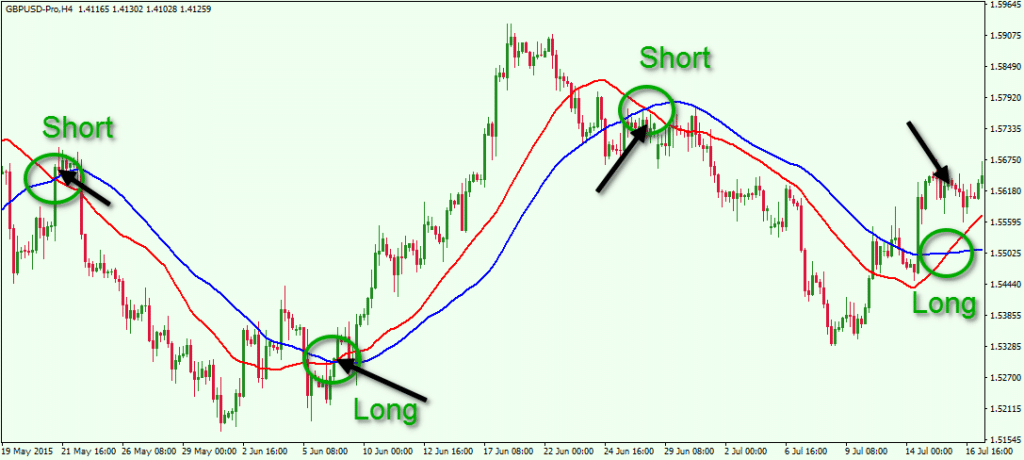
As discussed above, it involves using two moving averages say a 50-day moving average and a 200 day moving average. Whenever the 50-day moving average crosses the 200-day moving average and starts climbing up the same, indicate a buy signal, signaling it is time to eye buy opportunities as the price is likely to continue moving up.
Similarly, whenever the 50-day moving average crosses the 200-day moving average and starts moving lower, the same signals a start of a downtrend ideal for entering short positions.
While using one moving average say the 200-day moving average, buy position should be opened whenever price moves and dips below the moving average, followed by a sharp reversal that sees price bounce back and close right again above the moving average.
Likewise, a sell position would be ideal when the price is below the 200 days moving average, pulls back, peaks above it, but retracts again and closes below the moving average.
The Bottom Line
Trend trading is an important and effective strategy that uses technical indicators to identify the market’s direction. The long term strategy entails the use of indicators such as moving average to identify the underlying trend. With trend trading, positions are opened in the direction of the trend, left to run until the trend reverses, and starts to move in the opposite direction.

