Rectangles and triangles are two price action chart patterns that forex traders use to predict the future price of a currency pair. The patterns tend to predict whether a currency pair will continue moving in the original trend or whether it will reverse. In this article, we will explain the two patterns, how to identify them, and how to use them in day trading.
Rectangle pattern
A rectangle pattern is also known as a horizontal channel. It basically happens when a currency pair is finding it difficult to move above a key level of resistance, or alternatively, below a key level of support.
For starters, a resistance level acts as a ceiling and is a place where the price struggles to move above. Support, on the other hand, is a floor where the price struggles to move below.
Support and resistance levels can appear anywhere in a chart. However, in most periods, they happen at key levels such as a previous high or low or a key retracement level.
For example, if a rising EUR/USD reaches an all-time high of 1.1200, it will likely find some resistance there. That’s because many traders will start to take profit at this level as they ponder whether the trend will continue.
A rectangle pattern can happen between an ongoing trend or at the end of a trend. When it happens after a sharp uptrend, it can be said to be a bullish flag pattern.
To draw a rectangle in forex, you need to identify several levels of support and resistance and join them with a line tool.
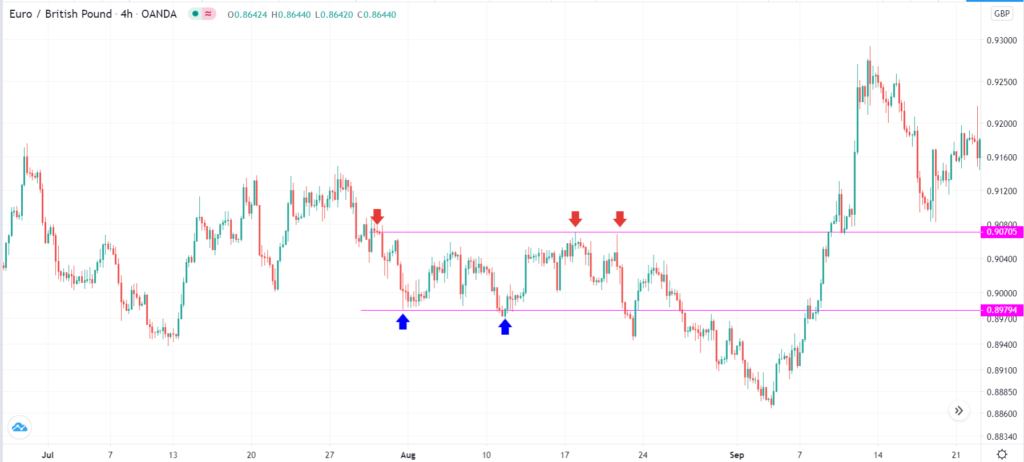
In the chart below, we see that the EUR/GBP pair is struggling to move below 0.8980 and going above 0.9070.
Example of a rectangle pattern
How to use rectangles in forex
There are several key strategies of day trading using the rectangle pattern.
First, you can buy when it hits the support and exit when it reaches the resistance and vice versa. Most traders tend to place the take-profit slightly below the resistance level.
Second, you can use limit orders to avail of the potential breakouts. A breakout is a situation where the price of an asset moves above or below the channel.
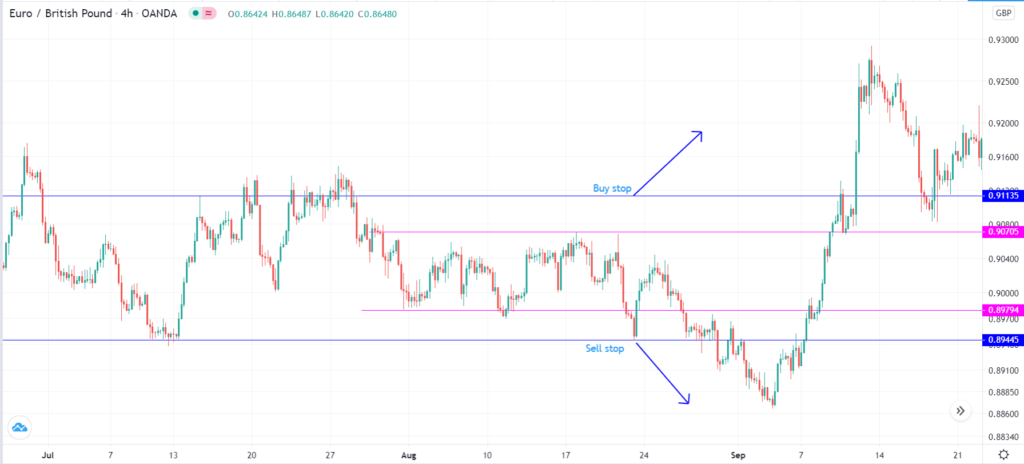
A limit order, on the other hand, is one that directs a broker to buy or sell when the price reaches a key level. A buy stop will implement a buy trade above the market price, while a sell stop will sell below the price. On the other hand, a buy limit is an order that initiates a buy trade below the market price, while a sell limit shorts above the current price.
Therefore, because it is difficult to predict when a breakout will happen, placing these limit orders will help you take advantage of the breakout. For example, in the chart above, a trader could place a sell stop at 0.8945 and a buy stop at 0.9113.
Using limit orders in triangle patterns
A stop loss is an invaluable tool when you execute your forex trades based on triangle patterns. This is a tool that will automatically stop a trade once a certain level is reached. Incorporating it will help you when there are reversals and false breakouts.
Triangles in forex
Triangles represent important continuation and reversal patterns widely used by traders in the forex market. As the name suggests, these patterns have three sides. In most cases, triangles are formed between an existing trend. They happen when many market participants get hesitant about the direction of a trend.
Three types of triangles occur in forex trading: symmetrical, ascending, and descending.
Symmetrical triangle pattern
The symmetrical triangle happens after a major upward or downward rally. It is characterized by two converging lines. These lines are usually higher highs and lower lows. The upper and lower lines should touch at least two swings. A good example of this is in the Amazon chart below.
Symmetrical triangle
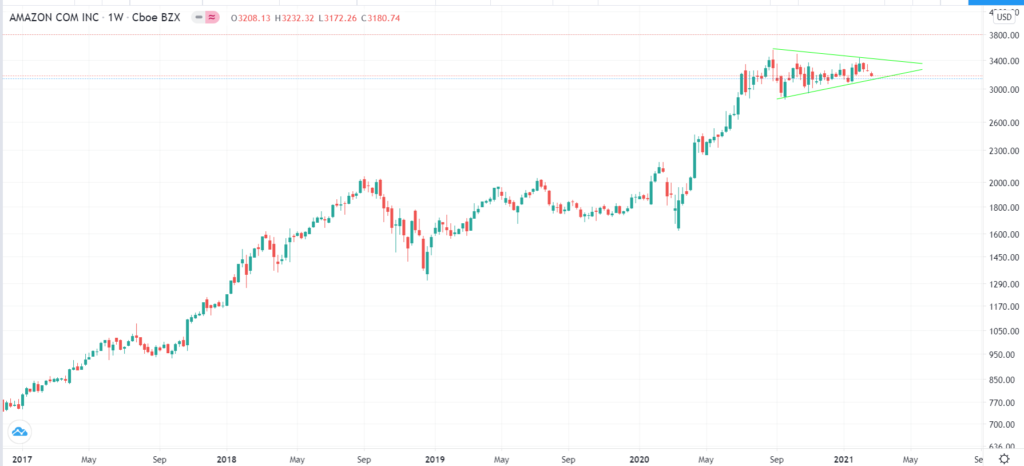
A symmetrical triangle is usually different from the other two triangles because its outcome tends to be difficult to predict. In fact, after the triangle ends, the price of an asset can break-out in either direction. Therefore, the best way to trade it is to use limit orders, as we explained above.
Rising triangle
An ascending or rising triangle happens when a currency pair or any other asset meets strong resistance. After this happens, the price drops as some buyers take profit. As it drops, some buyers return and push it back to the resistance.
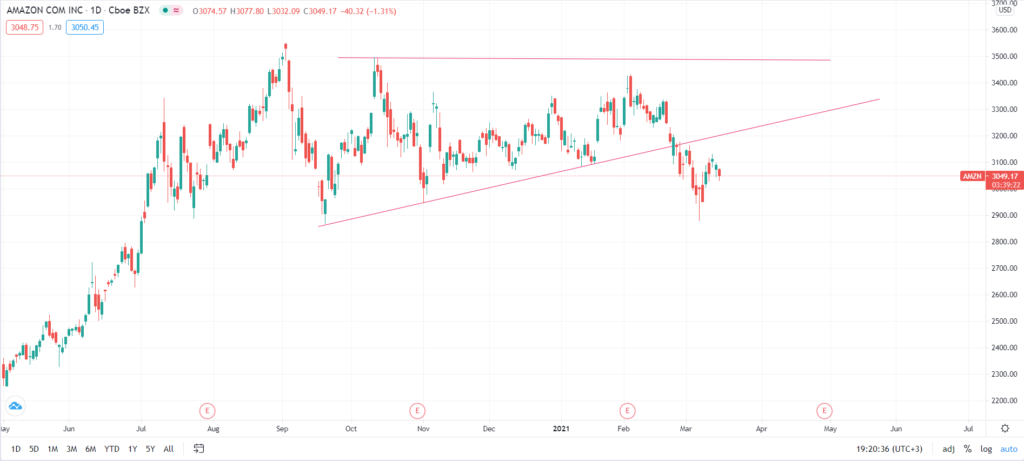
A trader can then draw a line to connect the higher lows with the resistance level. In most cases, an ascending triangle tends to break out higher since the original cause of the rally is still intact. A good example of this is in the Amazon chart below.
As you can see, the price rose to a high of $3,500, where it found significant resistance. It then made some higher lows. Ultimately, even after the false breakout, the stock made a bearish breakout.
Ascending triangle example
Descending triangle
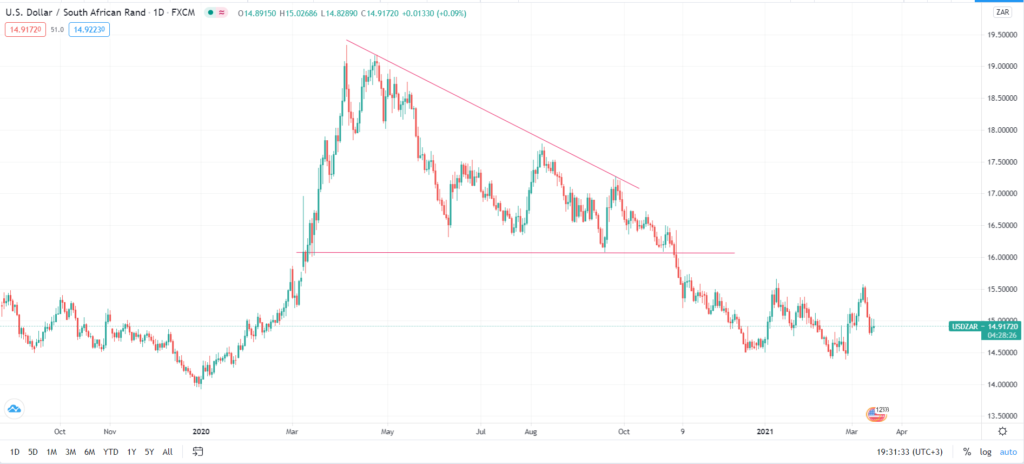
A descending triangle is a concept opposite to an ascending triangle, which forms when a falling currency pair or any other asset finds strong support. The price then starts to rise as some buyers return, but the upside does not go far. It drops and retests the support level. The price then rises again and loses momentum again. Ultimately, in most cases, the triangle pattern tends to break out lower.
A good example of this is in the USD/ZAR chart below. As you can see, the price was in a strong downward trend when it hit strong support at 16.33. It then attempted to rebound three times. The price then broke out lower.
Descending triangle example
Final thoughts
Triangles and rectangles are found on almost every list of the most popular trading patterns you will encounter in your price action journey. They are easy to identify and tend to be relatively accurate. In this article, we have looked at what they are, how to draw them, and the benefit of using limit orders to trade them.


