What Advantages do Traders have?
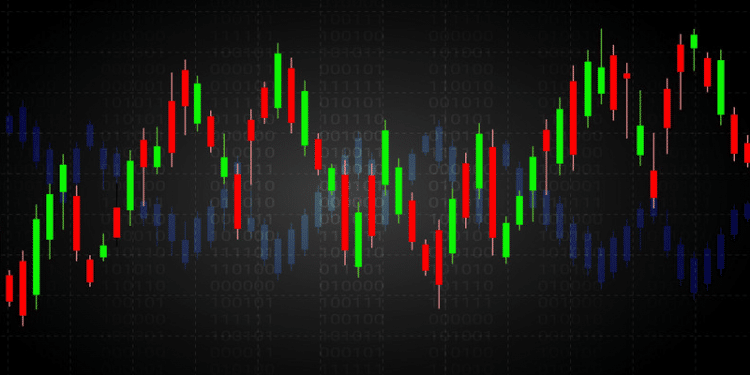
Candlestick charting methods have existed for more than a century. However, it has caught the eye of traders as a charting standard especially in the United States in the past decades. Novice and experienced traders alike develop a fierce loyalty towards using such patterns after thoroughly understanding their usage and potential.

Some of the salient features and advantages of candlestick patterns include the following:
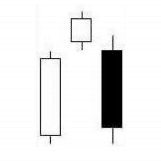
- Candlestick patterns are easily readable and visually appealing. Traders can get an understanding of what’s going on in the price of security simply by glancing once at the candlestick charts. They also get a sense of how the price is trending and whether buyers and sellers have dominated on any given day.
- One can easily spot the opening and closing price for security when using a candlestick chart. From a resistance and support point of view, these price levels can be important areas.
- It also features specific patterns that traders can identity and conclude when to buy, sell or wait on investment or trade. Traders can combine these with other technical indicators for producing more reliable results.
Different Patterns
Bearish Engulfing Candlestick
This is a reversal pattern with a bearish implication. It should first be in an uptrend, with the green candle as a continuation. A gap up above the close of the previous day should be seen on the next day. The body of the first candlestick should be engulfed totally by the 2nd-day candle. Within the next 2-3 candles, if the prices move below the low of the two candles, the bearish engulfing pattern is confirmed. When confirmed, you can take a short trade by placing a stop loss above the top of the two candlesticks.
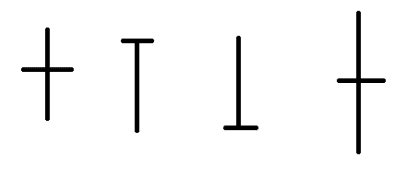
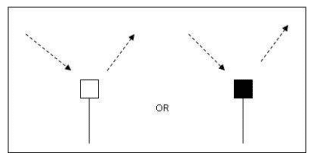
Dragonfly Doji Pattern
The Doji pattern is a single candlestick that assumes significance if it appears after a trending move, whether it’s up or down. This pattern symbolizes indecision and the incumbent trend can reverse. As a trader, you should either continue the uptrend or go sideways.
The appearance of a Doji can be a signal of caution that the erstwhile trend may be coming to an end. It’s open and close levels are at similar levels and its upper and lower shadows can be of various proportions.
Evening Star Candlestick
This pattern indicates that the price is bound to go lower. It forms after an obvious uptrend. This pattern is made by a long white body occurring at the end of an uptrend, usually when confidence is at a high. The following day gaps up although the trading range remains small. On the third day, a black candle is formed which indicates that bears have taken control of the market.
It is made up of a closing that is halfway down the white candle (two days prior). An optimal evening star signal should have a gap before and after the star day.
Hammer Pattern
The hammer occurs usually after a prolonged downtrend. There is strong selling on the day the hammer candle forms, often beginning at the opening bell. However, as the day goes on, the market makes a recovery, closing near the unchanged mark, or even higher in some cases. In such scenarios, the market is potentially hammering out a bottom.
The following conditions must exist for a hammer signal to be considered valid.
- The stock or security should be in a downtrend before this pattern occurs.
- The size of the body is half of the lower shadow.
- Traders witness continuous buying the day after the hammer is formed.
- There should be no, or a very little upper shadow. Even though the color of the body does not matter, the white body is more positive than a black one.
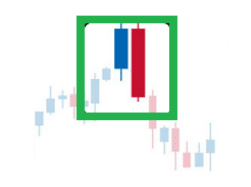
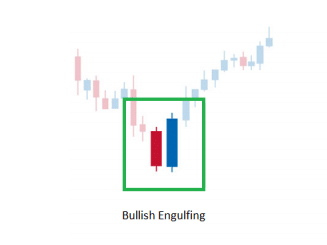
Bullish Engulfing Candlestick
This is a two-candlestick bullish reversal pattern. In this setup, you should first see if there is a downtrend. Depending on the charts you are using, you should have a red candle followed by a green candle. The body of the first candle is fully engulfed by the body of the second candle. The second candle constitutes the pattern and the day should start below the previous day’s close on a bearish note.
As the day progresses, the bulls in the market take over the charge, eventually succeeding in closing above the previous day’s high. In this scenario, the bearish engulfing pattern is confirmed if the highest point of these two candlesticks is breached on the upside with the next two to three candles. You can initiate a buy trade upon confirmation, placing a stop-loss below the low of the two candlestick patterns.
Morning Star Candlestick
This pattern indicates that prices are about to go higher. It forms after an obvious downtrend, made by a long black body in one of the fear induced days at the bottom of a long decline. The following day gaps down although the magnitude of the trading range remains small. On the third day, a white candle is formed which represents that bulls have now stepped in seized control of the market. In an optimal morning star, there should be a gap before and after the star day.
Gravestone Pattern
When the open and close occur at the low end of the trading range, a gravestone pattern can form. Here the price opens at the low of the day and rallies from there. However, the price is beaten back down to the opening price by the close. If it occurs at the bottom of the trend, the gravestone pattern becomes a variant of the inverted hammer.
Conclusion
There are nearly 40 patterns, that fall under the category of candlestick patterns. However, the above patterns are the ones that you need to remember always. Armed with this knowledge, you can easily have credible probabilities of indicating the future direction of a price move in the right way. You do not require intricate formulas or ratios when trading using candlesticks.

