Candlestick patterns are a specific class of patterns used mainly by traders to compare the behavior of price in different time periods. Candlestick patterns do a great job of communicating the dominant market sentiment in the market (bearish or bullish). To a trader, the ability to read candlesticks allows him/her to correctly form their strategies by taking the behavior of other traders in the market into consideration. In this article, we will talk about two important candlestick reversal patterns.
Pin bar
The Pin Bar is categorized as a reversal pattern and is an abbreviation of the term “Pinocchio Bar.” It’s a 3 bar pattern with the high of the middle bar towering over the highs of the other bars on the left and right. The middle bar takes the appearance of a pin, making it stand out like the proverbial sore thumb.
This pattern can be categorized as a single candle pattern that can be found, forming across all time frames and currencies in the market. It’s a reversal pattern as its appearance signals that a reversal is going to occur. However, very few pin bars actually cause large reversals to take place in the market.
These come in two varieties: Bullish Pin Bar and Bearish Pin Bar. A Bullish Pin Bar signals a reversal to the upside, while a bearish pin bar signals a reversal to the downside.

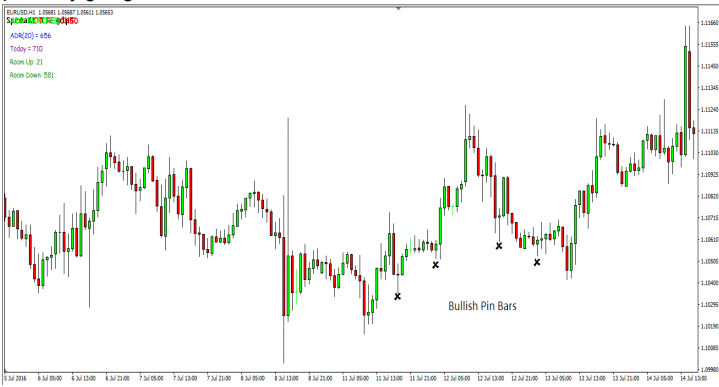
The above chart shows some bullish pin bars formed on the EUR/USD 1 Hour chart. As seen above, the majority of the bullish pins caused the market to reverse once formed. However, they didn’t all cause it to reverse for the same duration of time. While some created small retracements, others caused large upswings to take place.

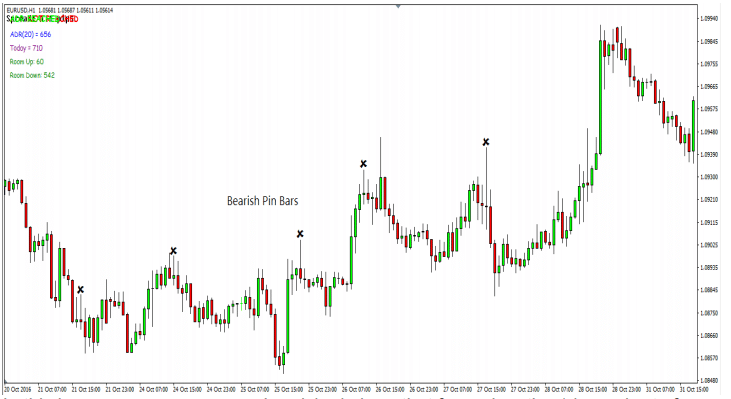
The above chart shows some bearish pin bars formed on the USD/JPY 1 hour chart. Similarly, here, there are pin bars that cause reversals of varying sizes influenced by the action that caused the pin bar to form in the first place.
How are these useful?
Pin Bars form as a result of traders making decisions in regard to the market price, specifically due to the actions of bank traders in the market. They either place the trades because they want to make the market reverse or to take profits off trades that they’ve already placed.
The reversal caused by bank traders taking profits off their trades is significantly smaller than the reversal caused by the pin which has formed from the bank traders placing trades to reverse the market. This is because the bank traders want the market to continue moving in the direction in which their trade has been placed, allowing them to make more money from a particular trade.
Pin Bars are thus formed from taking profits from the banker’s own trades, which are much smaller than reversals caused by other pins.
Both bearish and bullish pin bars are important reversal patterns to watch out for if one is a price action trader. However, they must be traded in the right way. Also, knowing why the pin bars form will help traders determine which pins have a higher probability of working out more successfully than the others.
Understanding the Engulfing Candlestick pattern
The engulfing candlestick pattern is the other candlestick pattern that traders should be aware of. Similar to the pin bar, the engulfing candle is also a reversal pattern, which means that a reversal is supposed to take place immediately after it forms. However, unlike the pin bar, the engulfing candlestick is a two-bar reversal pattern. This means it requires two to be present to complete the form.
Types of Patterns

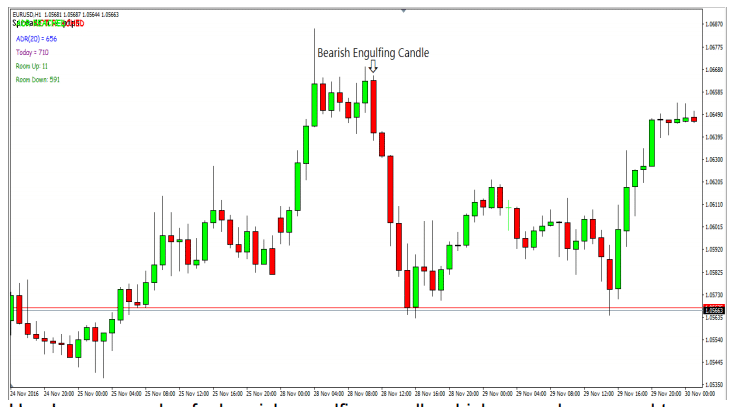
The above chart is an example of a bearish engulfing candle on the EUR/USD chart, which caused a reversal to occur.
- When a bearish engulfing candlestick occurs, it’s always a signal of a reversal to the downside. The pattern consists of two candlesticks: the bearish engulfing candlestick as well as a bullish candle forming one hour prior. The bullish one is the first candle required for a bearish engulfing setup. It is engulfed by the market with a bearish candle immediately after forming. Thus, in order for a bearish engulfing pattern to form, a bullish candle should be formed before.
- A Bullish engulfing candlestick is the opposite of the bearish candles, which means that it signals a reversal to the upside. Like their bearish counterparts, a bullish engulfing pattern is also a two-bar pattern, with the first candle being a bearish engulfing pattern instead of a bullish one. It should be noted that in both cases, a bearish candlestick cannot engulf another bearish candle, or a bullish candlestick cannot engulf another bullish candle. It always has to be the opposite.
How can these patterns be used?
Engulfing patterns can be best used as signals for entering trades at pre-existing points where the trader expects the market to reverse, such as supply or demand zones. They can also be traded on their own without using any other confirming factors. However, their success level is less compared to Pin Bar patterns.
Conclusion
It should be remembered that one should grasp technical analysis clearly before attempting to use candlesticks. While either of the patterns discussed above isn’t the “end all-be all” of all patterns that can form in the market, they are definitely two of the most important ones. Traders should thus take care to understand the underlying processes before using them. They can do this by going back to their charts and searching for instances where these patterns appeared in the market and find out how they cause a reversal to take place.
By doing this exercise, it will help traders not only to recognize patterns easily but also to easily determine when a reversal is about to take place which will allow them to place trades at more profitable prices.


