The vortex indicator consists of two lines, and when they intersect, buy and sell signals are generated. This indicator is constructed based on the peaks and troughs of the previous two periods or days. When the distance between the previous low and the present high is long, it depicts a strong positive trend, and when the distance between the previous high and current low is long, it indicates a strong negative trend.
When a bearish or bullish crossover occurs, the peak and trough for the day become the entry prices for long and short trades, respectively. Since the levels might not be reached on the day the signal appears, a Good ‘Til Canceled (GTC) might be used for more than one session.
If the peak and trough are positioned at the same time the crossover occurs, they become the stop and reverse action level. Thus, a sell trade will be conducted and reversed into a buy trade once the price reaches the extreme high after a positive crossover. On the other hand, a buying position can be reversed into a short trade after an extreme trough is reached by the price due to a negative crossover.
Vortex and RSI
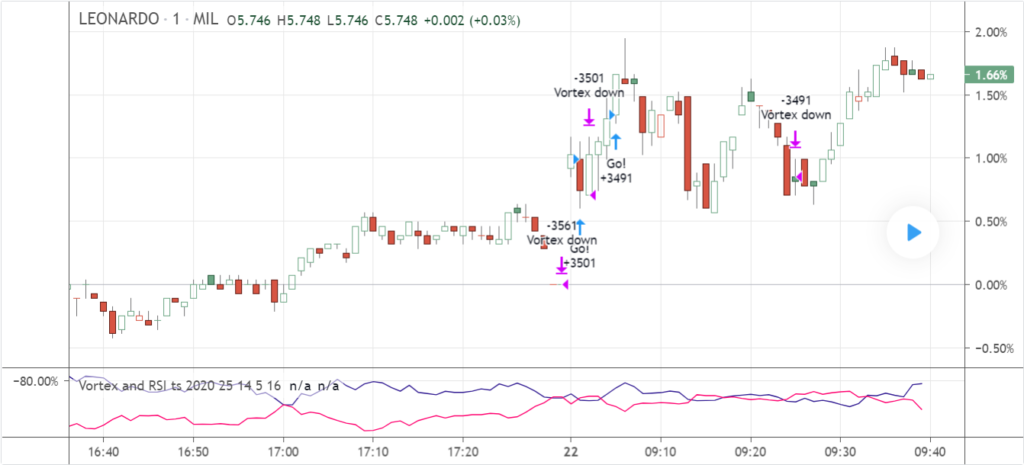
This strategy can be used for conducting long trades on shares. You should make an entry in case the Vortex up intersects the Vortex down from below and if the price closes at a point higher than the previous day’s peak.
An exit should be made when the Relative Strength Index reaches below 70 or when conversely, the Vortex down intersects Vortex up, and the current closing price is lower than last day’s trough.
Vortex with MACD
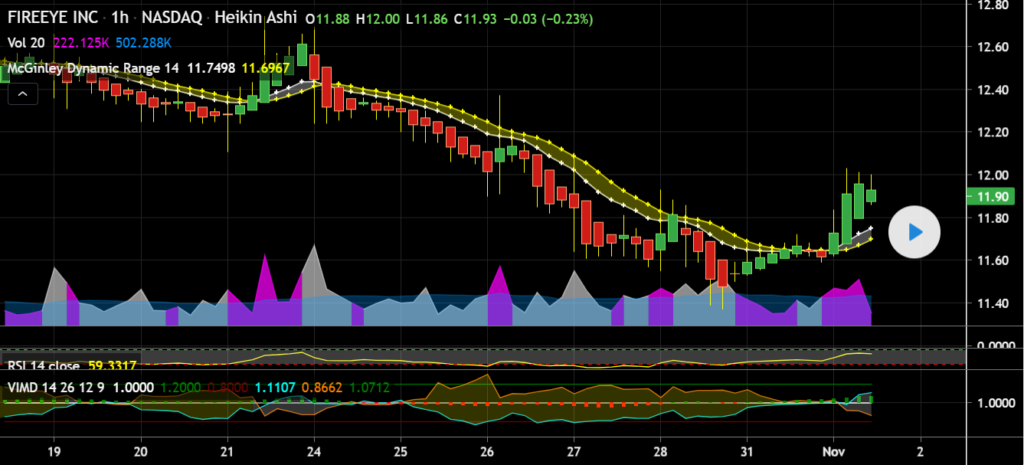
This strategy combines the Vortex and Moving Average Convergence Divergence (MACD) indicator in order to look for crossovers. When you see both the indicators showing crossovers at similar times, you know it is a strong signal to enter a trade. If, after a lengthy downtrend, there are crossovers, it is the perfect occasion to initiate a long trade.
Although it is not necessary for the crossovers to occur at the same time, the time difference should be small. You should look for crossovers at a minimum distance of 3-4 candles. You can keep your position open for almost half an hour when you are trading on a 5-minute timeframe.
If following a bullish trend, the crossovers appear, you know it is a good time to initiate a short trade. The same rule for keeping your position open applies here as well.
Slope Vortex
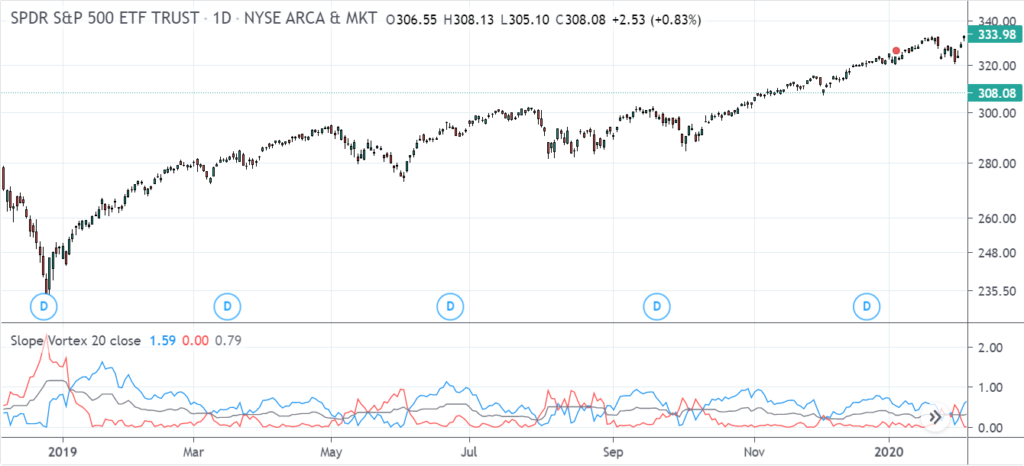
The slope vortex indicator takes a couple of slopes from the trailing time period indicated by you. One of them is from the time period’s highest point while the other is from the lowest point. Both of these slopes are then plotted by the indicator.
You can use this indicator with crossovers. When the blue line intersects the red line and moves below, it signals the end of a bullish trend or the fact that its testing support at the point. Conversely, when the blue line crosses above the red, it signals the beginning of a bullish trend or that its testing resistance.
You know a trending action is present when the two bands advance away from each other with increasing width. In case the bands are narrow and keep intersecting each other, you get the indication of a consolidating or ranging signal.
When the black “midpoint” line moves up, you can say that the trend is gaining momentum, and if it remains flat or goes down, it means the preceding trend is slowing down, or there is a ranging condition. If the lines get close to the midpoint line without crossing, it is a confirmation of trend strength or the indication of a support and resistance zone.
Vortex EMA
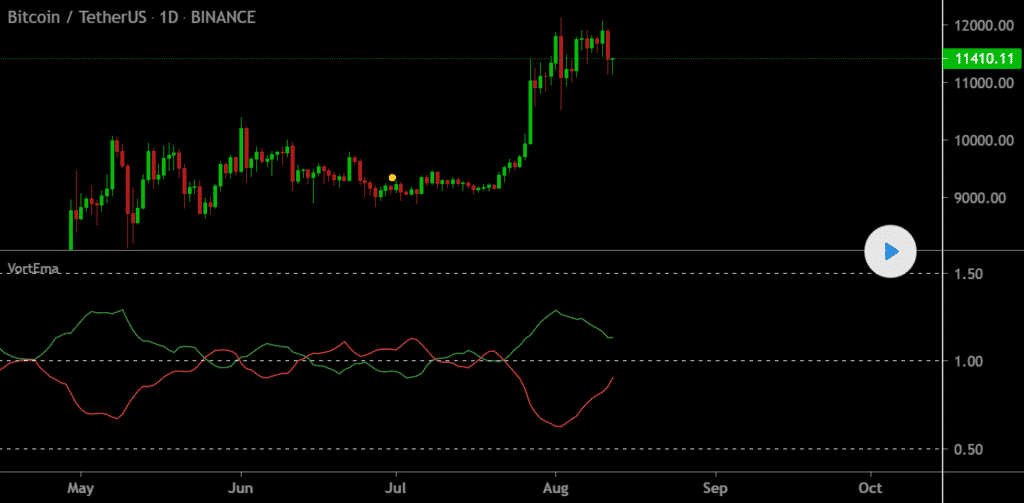
In order to identify the direction of the trend, here we use the Vortex indicator along with William’s Percent Range and 21 EMA. When the market is moving slowly, it is difficult to generate profits using this scheme.
You should enter a long trade when the price exceeds the 21 EMA line, the moving average candles are blue, the lime-colored Vortex line is moving upward and is situated above the magenta-colored one, and the WPR line is moving upward and is situated above the -50 level.
The asset should be sold when the price crosses beneath the 21 EMA line, the moving average candles are red, the lime-colored Vortex line moves downward and beneath the magenta-colored line, and the WPR line is moving upward and is situated below the -50 line.
Vortex Trend Tracker
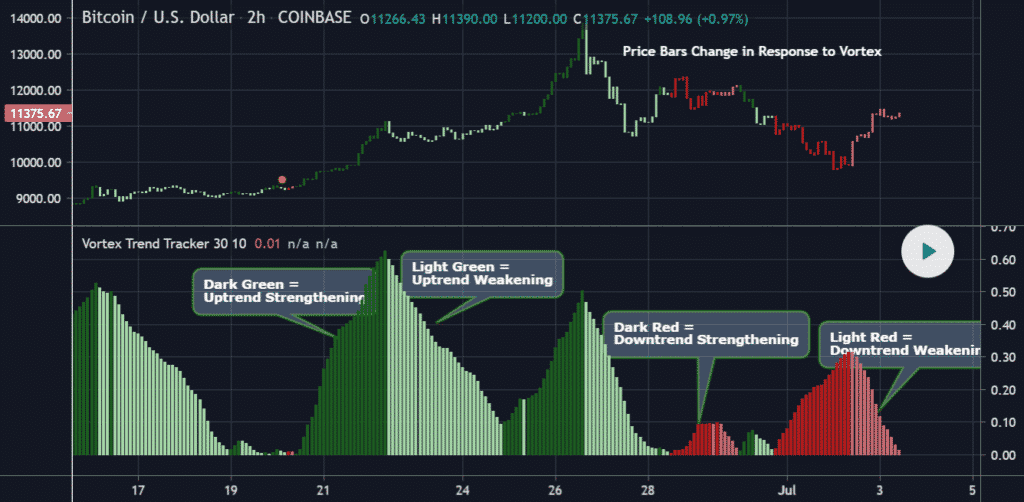
Here we use an EMA with a length of 10 in order to lessen the impact of the whipsaws generated by the Vortex indicator. The main histogram in the chart depicts the absolute value of the difference between the downtrend and the uptrend line.
When the uptrend line exceeds the downtrend line, signaling a positive trend shift, the color of the histogram bars will turn to dark green or light green. The dark green color appears when the uptrend line has just intersected the downtrend line or when it is greater than the downtrend line and increasing. The light green color indicates that the bullish trend is becoming weaker.
When there is a negative trend, and the downtrend line exceeds the uptrend line, the bars will be light red or red. When the downtrend line is increasing or has just intersected the uptrend line, the color of the bar will be red. Light red color indicates a weakening downtrend.
Summing up
The similarities between the chart situations are as follows:
- They can be used for anticipating and identifying reversals.
- You can gauge the trend strength using them.
- Volatility can be measured with the help of the True Range.

