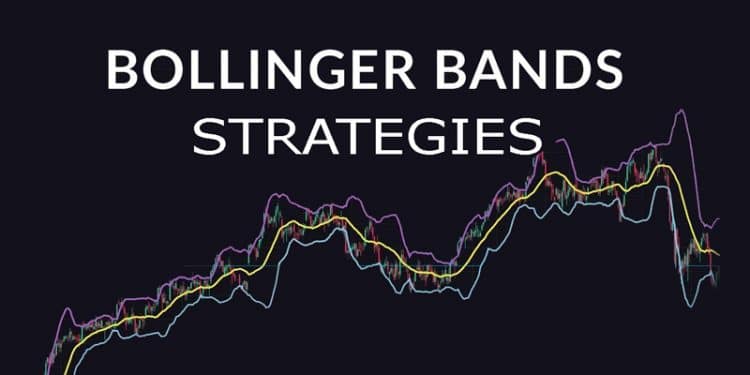
Several Forex merchants regard Bollinger Bands as one of the most potent indicators as they can use them to assess the nature of a trend and identify decent entry points. Some players in the Forex market think that in order to make consistent gains, more indicators are needed, but this is far from the truth. Sometimes the simplest indicators can work wonders for you, so let us look at Bollinger Bands in detail.
What are Bollinger Bands?
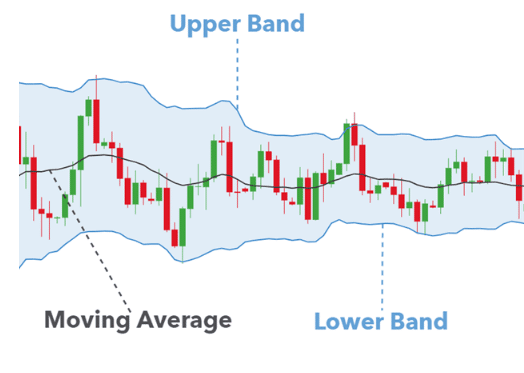
Bollinger Bands is an instrument for technical analysis that uses standard deviation (SD) to demarcate the resistance and support levels on a trading chart. It was created by John Bollinger who wanted to create an indicator that could point out comparable lows and highs in a market that’s moving dynamically. It consists of 3 lines:
- Upper Band: Two SD above the MA
- Lower Band: Two SD below the MA
- Middle Band: 20-period SMA
The two bands are enfolded around the price action and the gap between them grows larger when a certain currency pair has got high volatility. Oppositely, when the market volatility is low, these bands shrink, i.e., the gap between them reduces. The particulars provided by this indicator include:
- Whether a trend will persist or reverse
- Market stability phases
- Impending phases of huge breakouts caused by volatility
- Probable highs and lows in the market
Bollinger Bands calculation
Let us look at how the three different parts of Bollinger Bands (BB) are calculated:
- For the upper BB, the MA of the close must be calculated, and the SD must be added to it. Thus, you first need to compute the moving average of 20 periods and add it to the 20-period standard deviation multiplied by 2.
- The lower BB is computed by subtracting the SD from the 20-period MA. Thus, the formula can be represented as MA20-(2*20-period SD of close).
- The third line, or the 20-period SMA is computed by adding the asset’s ending prices for the past 20 days and then dividing the value by 20.
Bollinger Band trading strategies
The different Bollinger Band trading strategies are as follows:
- Trend trading
When the Forex market shows large shifts in price and time in the direction of the trend, an impulse move is said to have taken place. On the other hand, a corrective move occurs when smaller moves take place in the market contrary to the general trend direction. These can be measured accurately with the help of Bollinger Bands.
- If the price bar shifts adequately to touch the lower or upper BB, it is labeled as an impulse move. This acts as proof that the wave is strong in that particular direction and thus suggests the beginning of a trend.
- When the market moves against the direction of the trend, there is a good chance of it retracing back to the MA. But, the trend shouldn’t shift so much that it touches the BB lying on the opposite side. In case this happens, it signals the presence of an impulse wave in that particular direction, whereas the preceding impulse wave is negated.
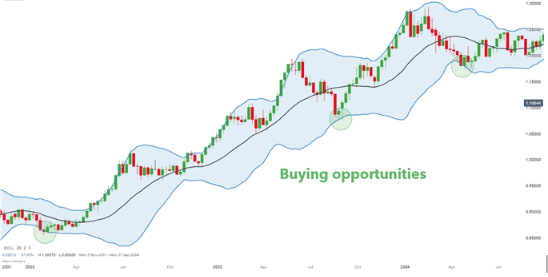
Take, for example, the bullish EUR/USD chart shown above. When we use BB along with it, the support scale is depicted by the lower BB. Forex players see it as a buying opportunity when the price reaches the lower BB. You may also use this scheme for a bearish market.
You need to set the take profit limit from the two bands based on the nature of the trend. For this purpose, the take profit region can be represented by the upper band.
- Squeeze trading
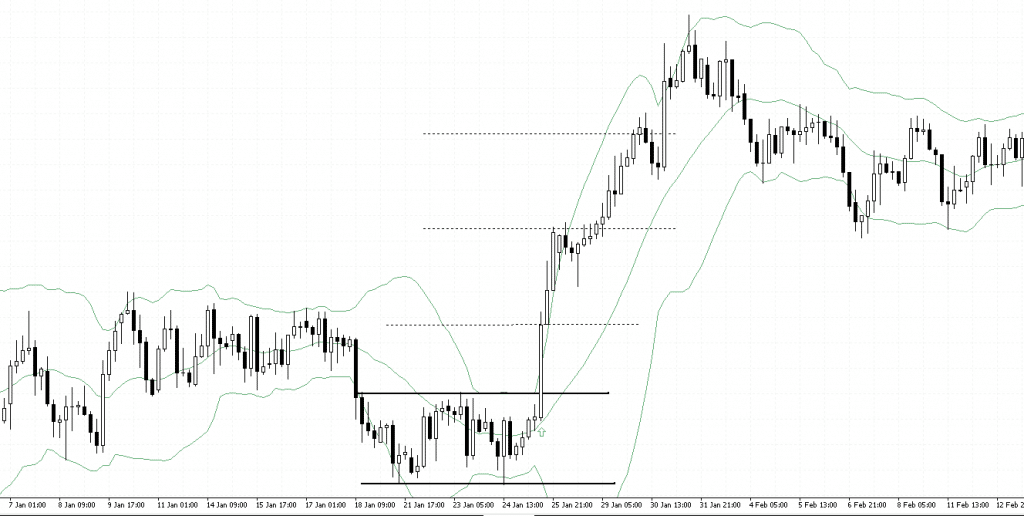
This trading scheme involves identifying the consolidation areas first. You can point them out when the bands start to shrink. After identifying this system, you can use horizontal lines to demarcate the range’s peaks and troughs.
You ought to anticipate the breakout after identifying the price levels, but you should keep in mind that the direction of the breakout is unpredictable. Thus, there should remain not a shred of doubt in your mind about the direction of the breakout. After determining this, you can start trading in the proper direction.
From the figure above, it is apparent that upon the contraction of the bands, a sideways movement of the price action takes place. You should prepare your set up at this point, waiting for the expansion of the bands and the breakout to take place. Following the breakout, you can enter a long trade as the new session begins.
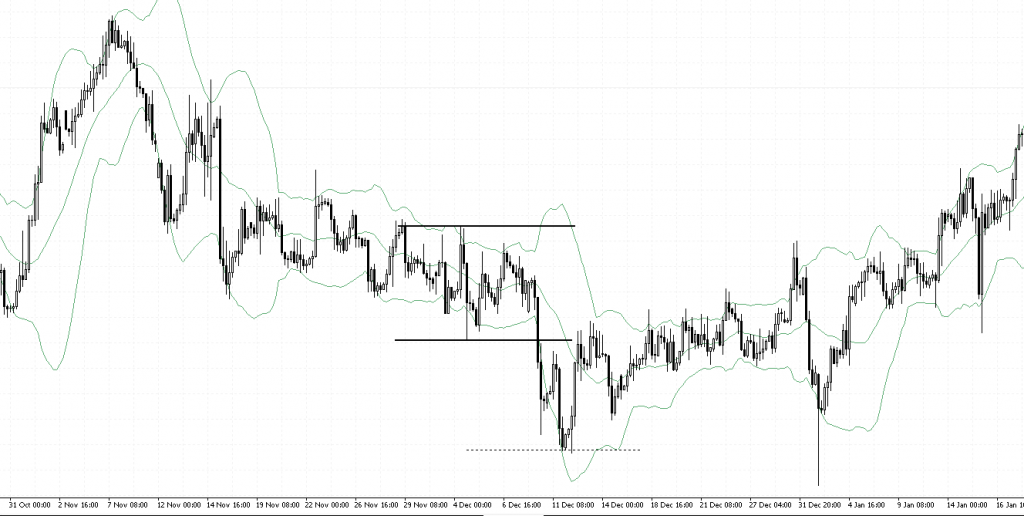
The above figure represents short trading set up using BB. After identifying the squeeze area, the range’s peaks and troughs are to be plotted. After this, a short entry can be carried out once the downside breakout takes place.
- Moving average breakout
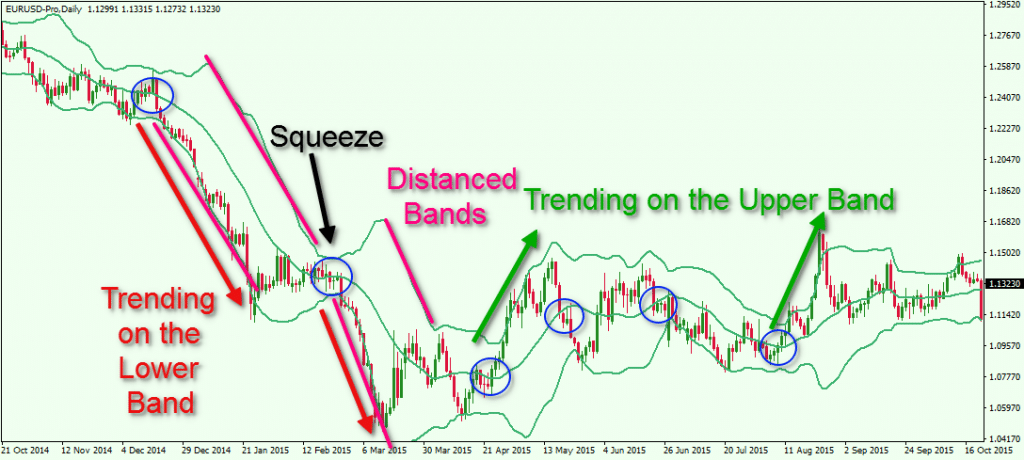
In this scheme, a short trade signal is produced when the price rebounds from the upper BB and intersects the 20-period SMA in a downward direction. Conversely, when the price rebounds from the lower BB and crosses the 20-period SMA in a bullish direction, a long trade signal is engendered.
- Double Bollinger Bands
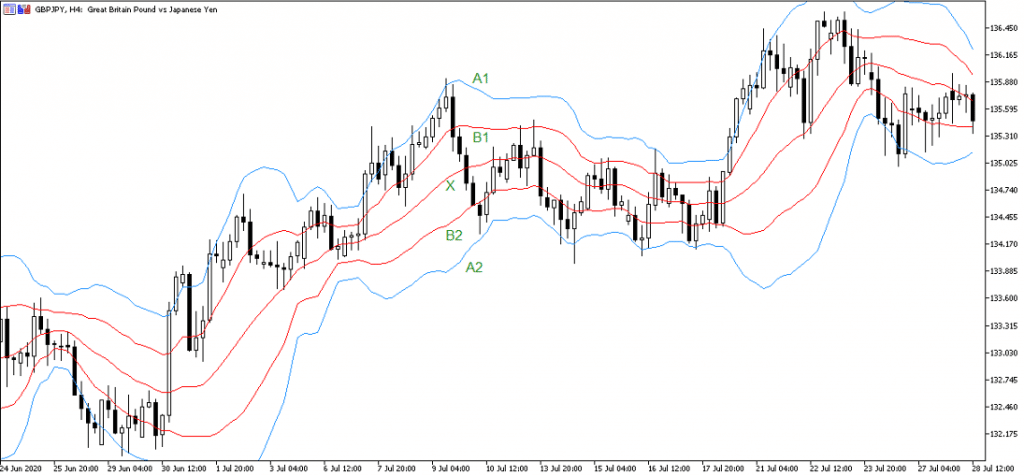
When the asset’s price lies between A1 and B1, a solid bullish trend is indicated. Thus, traders tend to open long trading positions or hold their existing ones. When it hovers between A2 and B2, it signals the continuation of the bearish trend. Therefore, it is a good opportunity for a trader to open short positions or hold existing ones.
Summing up
As is apparent, Bollinger Bands are versatile indicators that provide you with vital information related to the trend. You can judge how strong a price movement is by using more than one band. They are long-term indicators that are easy to use, which is why most traders favor them.

