Sometimes even the most well-laid plans can go awry. This is the case with bull traps. These are traps that creep upon traders suddenly and cause traders who are snared to lose big. This is an exasperating situation to be in as the signals indicate a good buying trend, but actually, the opposite happens, leading you to react to the false signal and lose your trade. Let us see how to spot and avoid them or turn them to your advantage.

What Is A Bull Trap?
This is a phenomenon that happens in the following way:
- In the event of a sell-off of longer duration, where either the traders are too greedy wanting more profits or have missed profit-making opportunities, there is a steady upsurge.
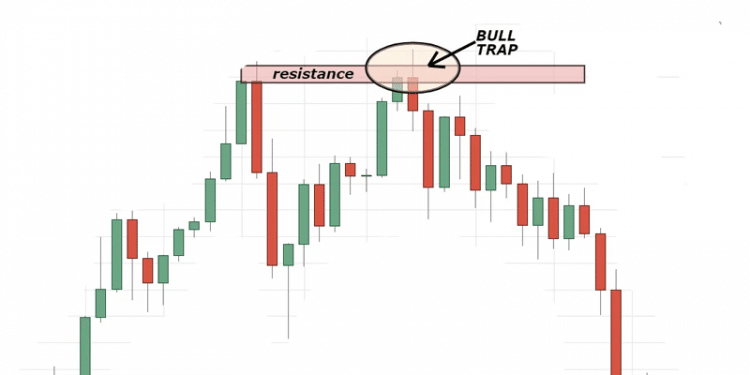
- When there is an uptrend, and an asset’s value keeps increasing up until it touches the resistance level, traders expect a break past this level and continuation of the uptrend.
- But a reversal occurs, resulting in a bearish swing, which is termed a bull trap. This is because traders who have placed stop losses would have removed them, while those who are still holding one will end up losing.
This sequence of events leads to what is called a bull trap as it snags traders unawares. It typically has an asset breaking via high resistance levels followed by an upswing but ends in a bearish downturn.
Identifying Bull Traps
The reason for traders falling prey to the bull traps is because the value of an asset generally surges in the wake of a breakout and does not reverse. So, it is difficult to spot such traps. But you can still spot them by:
- Performing the following analysis on the trades – technical and fundamental analyses.
- Find whether the specific asset is overbought. This denotes a reversal of price from the prevailing upward trend. An RSI is a good indicator to use in this situation.
- Wait before you open a long position in the wake of the breakout to wait for the upswing to continue.
Example Of A Bull Trap
Find below a typical example shown in a XAU/USD chart with a one-hour timeframe.
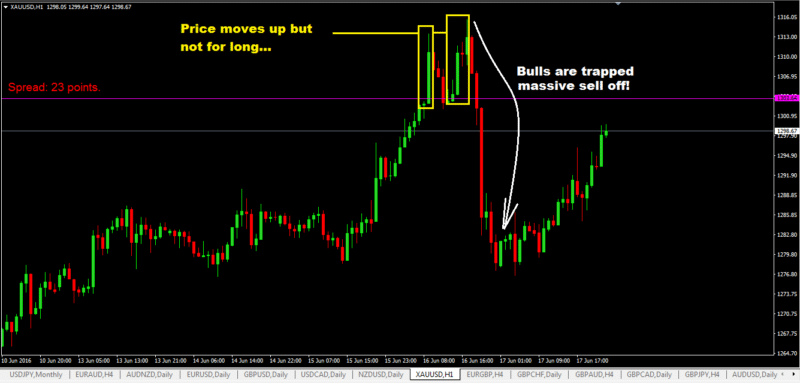
Find the price moving on an upswing breaking resistance levels. However, the upswing does not stay so for long. It drops sharply.
How To Avoid Bull Traps
There are certain things you can do to avoid being lured into the bull trap.
Avoid Late Entries
Since longer and sustained uptrends from the trap for traders, they should look for such uptrends and avoid making late entries. Only an unsuspecting trader will enter at such a level and fall prey to the trend reversal.
Perform Multiple Retests Of A Resistance Level
When the price performs specific stops at the resistance level following a sustained upward move, you can take this as a sign of a possible reversal waiting to happen.
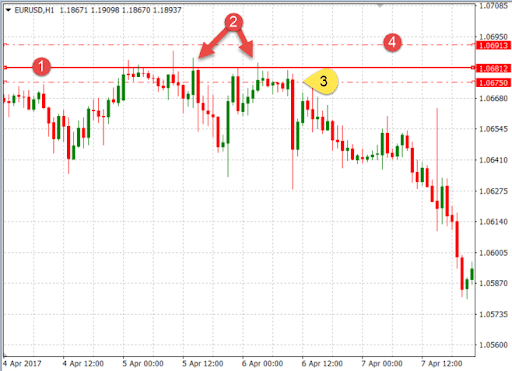
The image below shows how prices had a potent bullish move, and on touching the resistance level, there are three retests prior to the downtrend.
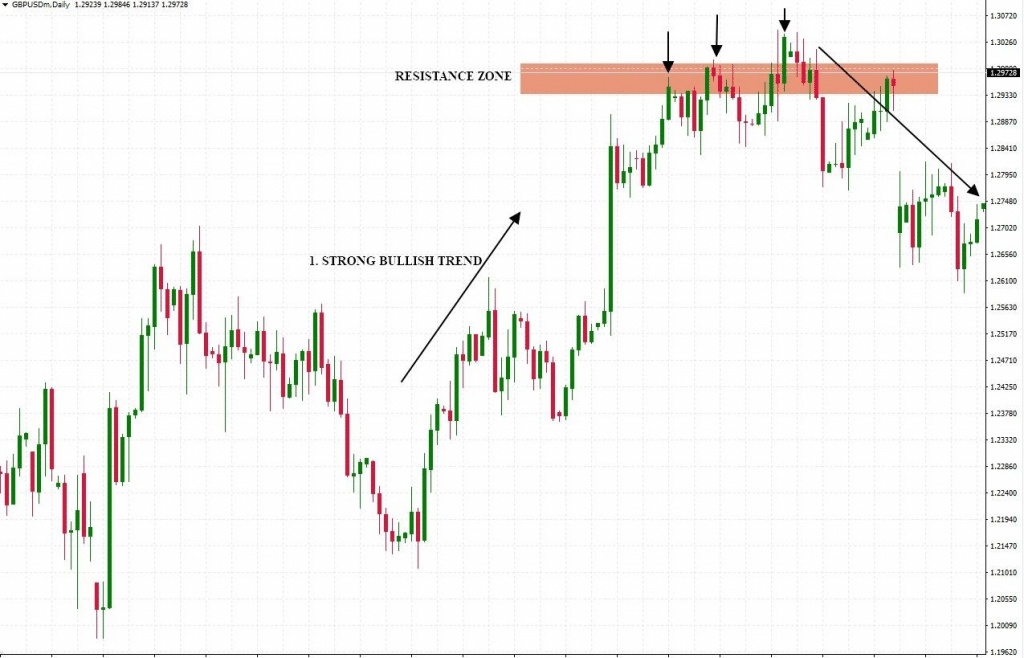
The drop is because the buyers have given their maximum input, but after reaching the resistance point, they do not sustain.
Look For Indecisive Candlesticks
Spinning tops or dojis are definite signs to beware of. This is especially true when you spot them just after a breakout of an upward trend. If you do so, avoid going long in such a condition. This is because the indecisive and multiple candlesticks indicate a lack of direction of the market.
The attempts for the rate to breakout does not occur with all candlesticks staying below the level. This clearly indicates you should not enter the trade until you find an upside breakout and a properly executed pullback following it.
The bearish candle at (3) denotes a selling chance for a trader with a stop loss placed at the line (4).
However, keep in mind that if the breakouts are genuine, you can expect a stronger uptrend further with a bigger volume of trading.
For a real breakout to occur, you should look for a powerful candlestick with a bullish streak immediately following a breakout. This can signal a continuing uptrend.
Place A Large Stop Loss
One effective way to avoid the trap altogether is placing a bigger stop loss.
While this may make you elude the trap, you will not always know the extent of the price surge until a drop occurs. So, it will not be easy to decide on a specific stop point.
Trade In The Direction Of The Main Trend
When you spot a breakout on an upward trend but not in line with the bigger trend, avoid trading as this is a definite signal for a bull trap.
This happens when traders try to enter at the breakout point to follow the bigger trend. This will force the price to drop to help them liquidate and make a profit.
Recap
For an amateur trader, a sustained price rally is a big lure to enter trades. They keep holding on to the trade even after a price reversal occurs in the form of a bull trap. With the price dropping, the loss keeps increasing. With the tips to avoid this situation, you can easily steer away from such losses.
Further, falling prey to a bull trap does not always signify a loss for a trader. Setting up a trailing type of stop can prevent bigger losses that occur as your trade enters the bull trap. Another way to counter this trap is to go short when you spot a bear trap is in place. Thus, identifying such traps, learning how to avoid them and whether it is possible to trade them with minimum risk is easily done if you know what to look for and how to move your trade.

