
The ascending scallop is a J-shaped pattern with a rounded bottom/valley in between the formation. It has two peaks – the left one is lower while the right one is higher. The left part is wider at the beginning of the pattern, and it narrows near the end. The pattern is formed when the prior price trend is trending upwards. It is common in a bull market.

The price first peaks retrace downwards, then curves in a round shape. It then forms a higher right peak which is narrower than the beginning. It has an upward breakout that informs the trader of a bullish continuation pattern. Tall J-patterns have better performance as compared to short ones. Although scallops tend to be bullish, the sight of a downward breakout at the end of a price uptrend signals a bearish trend change.
Identification
1. Prior uptrend
The scallops appear in a rising price trend that forms the J-shaped pattern. The prior uptrend shows that the scallops are formed in a bullish trade pattern. There should be two price peaks with a recession or a corrective phase in between the low and high peaks. These scallops rarely form in a downtrend or a bearish market.
2. J-shape pattern
Identify two peaks – one at the bottom and the other at the higher peak rising to form a J-shape pattern. There is a rounded recession from the lower peak as the pattern rises to join the higher peak (See figure 1).
3. Volume trend
There is a U-shaped volume trend as the scallop ascends to join the higher peak of the pattern. In figure 1, volume changes from mid-January 2021 to February 8, 2021. The low volume features from the start of the recession until it begins to increase as the corrective phase widens. Prices have declined 1.75% from $3.6250 to $3.5625.
Although scallops permit price variations, they are wider at the start of the formation and narrower at the end due to decreasing volume.
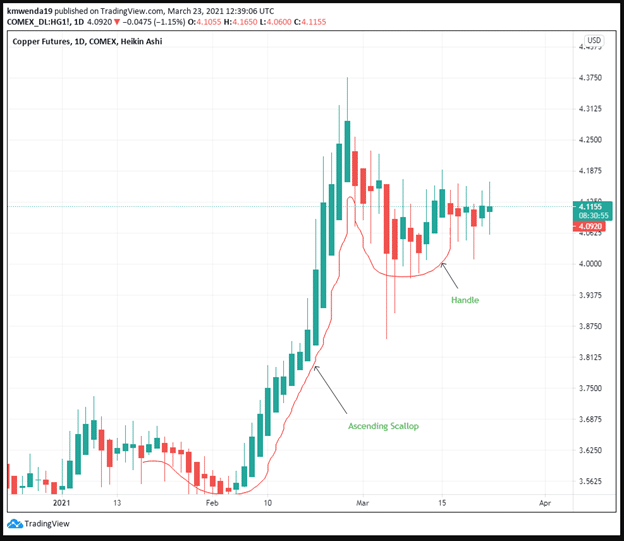
Figure 1: Ascending Scallop in Copper Futures
Figure 2 shows that the prices at the beginning of the trend are not equal to the prices at the end of the formation. Equal prices at both ends suggest an end to a trend line.
However, if you want to go long in stock, locating an ascending scallop will help you achieve just that. It works best in daily and weekly charts. Figure 1 shows that the price in the scallop rounds up neatly from mid-January 2021 to early February 2021. It rose to its peak of 4.3125 at the beginning of March 2021.
Trading strategy
1. Target Price Computation
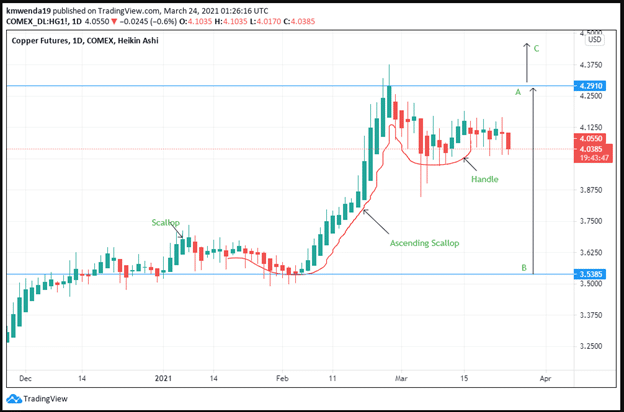
Figure 2: Calculation of the target price
Calculation of the target price as shown in figure 2 reveals that we have to first get the difference between the highest position on the ascending scallop with the lowest. In this case, we will subtract 3.5385 from 4.2910. The difference is equal to 0.7525. Since the figure shows an upward breakout, we will then add it to the highest peak marked A. We expect the copper futures (HG) to rise to 5.0435. In this target price, the trader will accrue maximum profit.
We can also expect the price to fall below the target price depending on the market dynamics. To be on the safe side, we can place the stop loss at the same distance from A. The stop loss can be placed at point B.
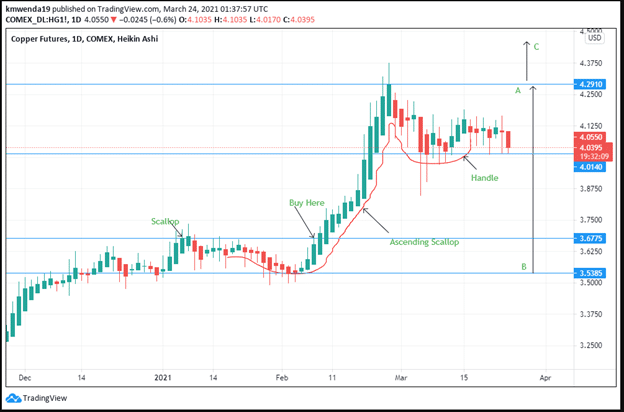
Figure 3: Buy Position of the Copper Futures
2. Buy below the handle
The ascending scallop is mostly followed by another rounded recession near the tip of the highest peak (point A). The trader can decide to wait and buy at this range keeping in mind the target price. The recession here is known as the handle. In figure 3, the buy position below the handle rests at 4.0395.
However, the best buying position should be before the handle is formed. The main caveat here is that the handle may be followed by a downward breakout that may reduce the profits intended. In figure 3, the best buying position has been described at 3.6775, just as the scallop is ascending. This position cuts across the prior price of the trendline that led to the first handle. Further, it shows the breakout position of the copper futures.
3. Stop loss
If you buy at 3.6775, you should place the stop loss at least 10-20 pips below part B. The right rim movement should guide the trader in analyzing the best investment position.
The trader should raise the stop loss position as the price increases with the ascending scallop. The most important thing is to first confirm the ascension of the scallop and continue moving with its rising position. The stop loss should not be placed too far down as it may affect the trading pattern.
4. The volume of the breakout
If the volume of the breakout is high, we expect the ascending scallop to outperform. Figure 3 shows an increasing volume pattern. The scallop rises as seen in the right rim, rising from point B to A. The marked buy position also shows an upward breakout. The handle at the top of the scallop also shows that the rising price trend may soon come to an end. The impending price change should inform the trader should relax the long position and prepare to sell short.
Conclusion
The ascending scallop is a J-shaped pattern indicative of a short-term bullish reversal. Traders can spot it in their daily or weekly trading charts. The reversal is, however, from a rounded recession and not a generally bearish market. The scallop ascends as the trend increases in volume. There is a prior uptrend in prices. This uptrend is important as it is used to confirm the breakout position. The pattern also has a handle at the higher peak. This handle shows the impending trend change. Traders should consider measuring the target price after first placing the buy position during the scallop’s ascension.

