Overview
There are numerous ways traders attempt to understand the markets. Whichever method is employed, one thing we can be sure of is no market travels in a straight line, unless momentarily. Mean reversion is a concept illustrating the ‘stop-start’ behavior of any market and how trends like to revert to the mean. Though we can observe the concept of mean reversion using any methodology, moving averages are one of the best ways to take advantage of it.

What is mean reversion?
Many analysts argue forex is one of the most mean-reverting markets than certain stocks that tend to stay in sustained trends for vast periods. In other words, there are more retracements or pullbacks in forex. Where these retracements travel to is where mean reversion comes in. Mean reversion is merely the idea that price will tend to ‘revert’ back to its average or mean. While we can easily spot this idea just by looking at a chart, its best application is with moving averages.
Moving averages were built on the principles of mean reversion since they attempt to calculate the average prices (typically the closing prices) of ‘X’ period and dividing that by X. The significance of the average price is high, considering that moving averages use price data that stretches many years. No matter how far back, certain prices still act as potential support and resistance areas where the market tends to revert. Traders look for price to revert to the mean or the average and look for further confirmations. This anchor has the potential to continue the price in the direction of the trend.
How mean reversion helps traders understand market structure
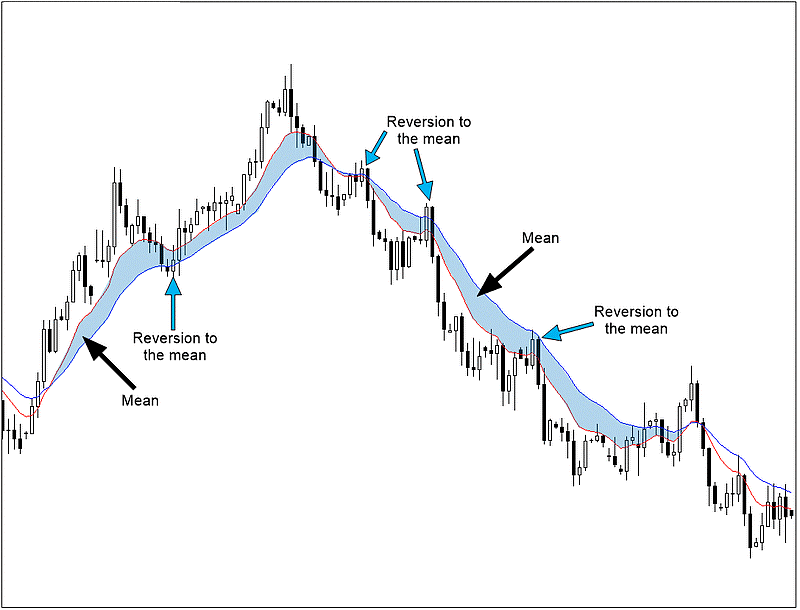
Mean reversion helps one to visualize the general structure of many trends in the markets, predominantly a trending market but also, to some extent, a ranging one. Rarely does any market travel in one straight line with very little pullbacks in between. It’s also improbable trying to enter right at the top or bottom of any trend. Any successful trader aims to wait for the mean reversion where price comes back to some form of dip in an established area and trading in line with the dominant trend.
Understanding mean reversion should prevent a trader from trading breakouts where it may feel ‘safe’ to enter in a market that appears to be moving. Instead of this approach, mean reversion is about waiting patiently for price to return to the mean for a ‘safer entry.’
Using mean reversion with moving averages
The ideas of mean reversion mesh very well with moving averages because this indicator is used primarily as a trend-following indicator. Any trend usually has several points where the market reverts to the mean by ‘dips.’ These are areas where traders look at how price acts around the moving average since it often acts as a form of support or resistance.
Many traders may argue over whether to use the simple or exponential moving averages, though the differences between the two are too few to hold weight. The important factor instead is the period and the time-frame of reference because that affects the mean reversion. A shorter period naturally will exhibit more points of mean reversion since the averages are a calculation over fewer periods. As a result, the average will appear squiggly, where it reacts more sensitively to price changes due to the period.
The most popular periods for moving averages are 5, 10, 20, 50, 100, and 200. We could assume the 5, 10, and 20 are better suited towards day traders, while the 50, 100, and 200 are favorite of swing or long-term traders. The higher the period, the less we’ll see mean reversion. Let us look at each moving average with the periods 20, 50, and 100 and see the differences in how the price reverts back to the moving average. For consistency, we’ll refer to only one time-frame.
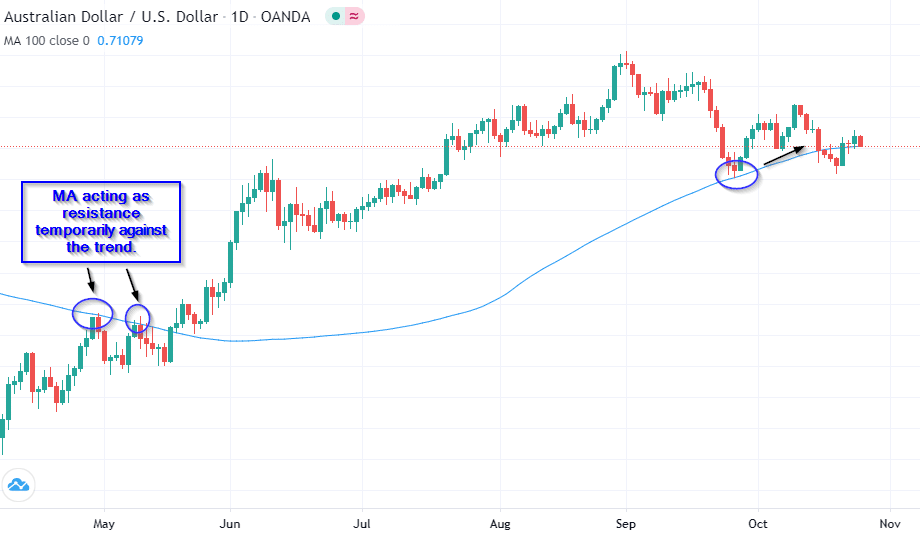
In the above image, we have the MA set to 100. We witness less mean reversion because of the higher period. It’s evident to see the instrument was mostly in an uptrend. At times, a strong trend like this exhibits pullbacks that are shallower than usual. In the next two images below, we see a reduction in the periods manifests more mean reversion as the moving averages account for more dips or pullbacks. We can also see how the moving average acted as resistance for a short while where the market reverted.
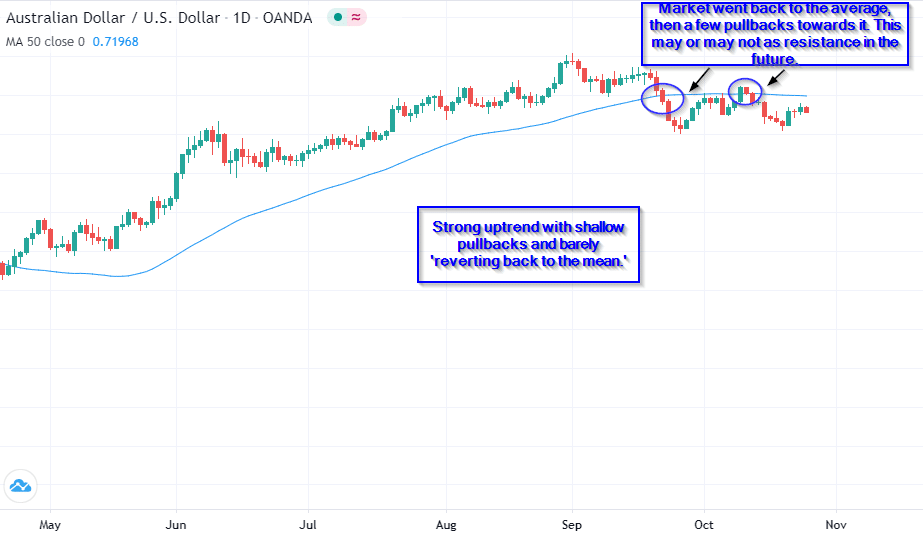
The example above uses the 50MA, which presents similar results to the 100MA where we see a strong uptrend and shallow dips where price barely reverts. Towards the top right corner, we can view an instance of price action around the MA that may or may not act as resistance in the near future.
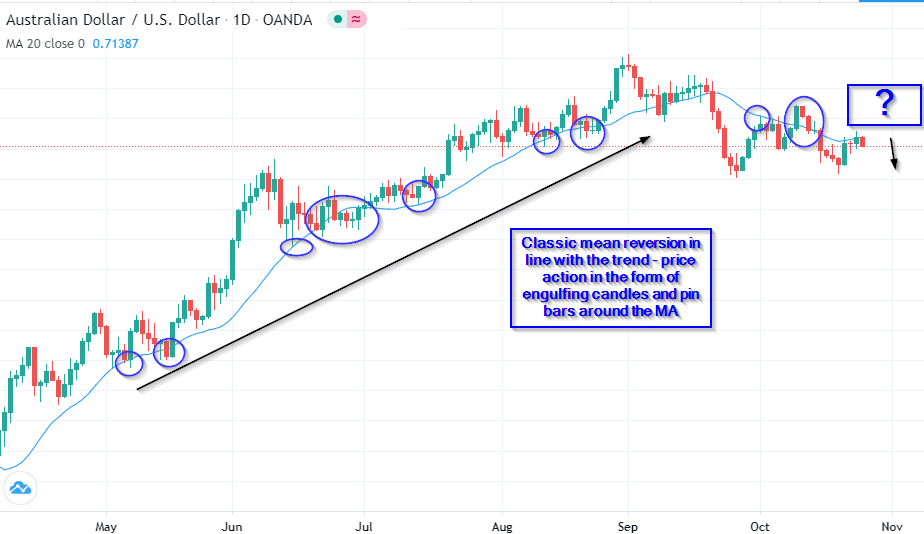
In this instance above, due to the shortness of the period (20), we can observe much more mean reversion where the market dipped numerous times on the MA before shooting up. This picture is the classic example of trend following that moving average enthusiasts typically want to see. Even for price action traders, engulfing candles and pin bars like to form around a moving average that already confirms an existing trend.
Conclusion
The main benefit of mean reversion is to aid us in appreciating how we should enter a trend. Rather than just blindly taking a position, a skilled trader waits for a pullback to a predetermined area, alongside other confirmations. Moving averages help in defining such areas and analyzing trends in the markets.

