
As a basic rule, when trading with the PSAR, you should buy when there is an uptrend indicated by the dots moving beneath the price bars and sell when the converse occurs, indicating a bearish trend. Thus, through the Parabolic SAR, you get frequent trade signals so you can always hold a position. When the price is subject to wide fluctuations upwards and downwards, this can be a good way to make profits with every trade, but in case the fluctuations are narrow, you stand the risk of losing several times back to back.

Thus, you ought to assess the daily price action to find out if the trend exists. Additionally, you should establish the nature of the trend. If a trend does exist, you should take your position based on its general direction.
The strong point of this indicator is that it helps you point out trends. If the trend has not been established, there is no need to fuss about PSAR’s weakness, which is a non-lucrative signal in the absence of a trend. Let us now take a look at 5 charts involving this indicator.
PSAR swing
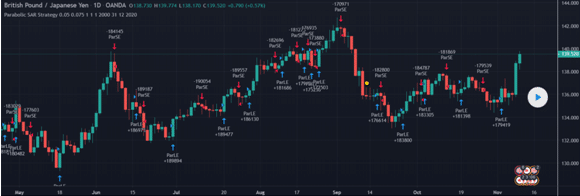
Consider the trading situation above, which is based on the GBP/JPY pair for a daily time frame. We will use a simple Parabolic SAR swing strategy for this purpose. Using this method, you can also select the time period to check its behavior during certain years.
This is not a complex strategy and even novice traders can use it for placing their positions. When the trend is bullish, the PSAR lies beneath the candlesticks and this is a great occasion for entering a long trade. Once the candlestick exceeds the PSAR, you can exit the trade.
For a bearish market, the same rule is applicable. In this case, when the Parabolic SAR lies above the candlesticks, this calls for a short trade to be placed. Once the candlestick exceeds the value of the indicator, you should exit the trade.
Heiken Ashi
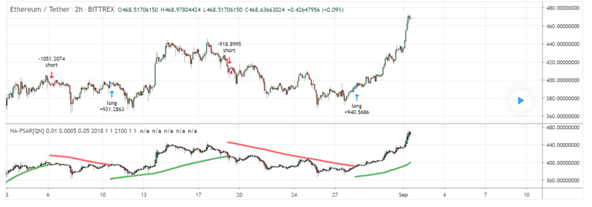
This is yet another simple trading system that merges the popular Heiken Ashi indicator with the Parabolic SAR for a 5-minute chart. Look at the chart given above that deals with the Ethereum/Tether pair. When the bar crosses above the PSAR, it is time to place a long trade and once the bar changes color from white to red, you should place your order at its top.
It is a good idea to continue going down on your order on the succeeding bar and wait for the order to be hit by the PSAR to shift upwards from below. In case you reach the take profit limit, the stop loss should be the PSAR and it should be moving alongside it. Remember, this strategy is computed on the basis of 25% equity and involves a commission of 0.1%.
ATR + PSAR
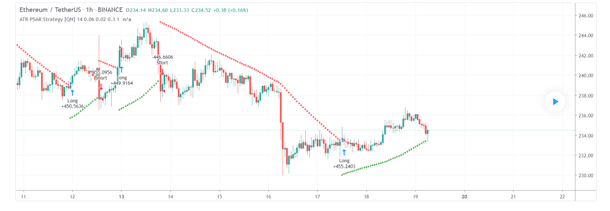
For this strategy, you first need to determine the trend and then calculate the acceleration factor, the extreme point, and the PSAR. The PSAR in combination with ATR allows you to establish conclusive take profit and stop loss points, ensuring you can make most of the trending market while not overexposing yourself to risk. It is based on the idea that the PSAR should move more swiftly when the market is volatile.
When the PSAR touches a candlestick from above, it is a perfect occasion to enter a long trade at the next candle and when it touches it from below, you can place a short trade on the succeeding candle. However, when the market starts to turn increasingly volatile, you should be able to accelerate the PSAR further.
3 moving averages
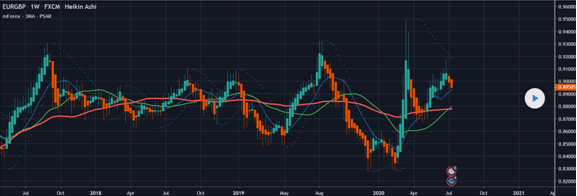
Using this method, you can point out bullish and bearish trends as per the mean price of the Parabolic SAR and MA lines. The rules of trading are quite simple here. Short positions are to be initiated when the 12-period moving average intersects the 26-period and 52-period moving averages from above and the PSAR reaches the price line.
The stop losses should be placed at the PSAR dots and the trailing stops should be facing upwards. You can also place them at the closest peak. The profit-taking limit should be R: R (1: 2).
Long positions can be initiated when the 12-period moving average intersects the 26-period and 52-period moving averages from underneath and the PSAR lies beneath the line denoting the price. The stop losses should be placed beneath the closest peak and the PSAR dots with trailing stops facing downwards. The rules for profit-taking remain unchanged.
Chop zone entry
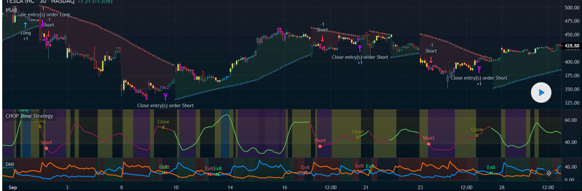
You may utilize this stratagem to confirm a trend and avoid a flat market by only entering when there are notable movements. When the reading exceeds the upper limit, you can expect the market to keep moving sideways, and when the reading lies under the lower limit, it is a signal that the trend persists. Future trend shifts can also be predicted using this system, with long consolidation periods being succeeded by long periods of trending movement in a fixed direction.
For judging the intensity of the trend, you must place emphasis on the ADX line where a value more than 25 signals a strong trend, and a weak trend is signaled by a value being less than 20. For making a long entry, the chop must exceed 61.8; whereas, for a short trade, it must be lower than 38.2. Furthermore, the PSAR and the momentum must trend upwards for a long trade and downwards for a short trade.
Summing up
The similarities between the chart situations are as follows:
- They indicate trend reversals.
- They aid in the placement of stop losses.
- They accelerate in the direction of the market.
- Over time, the PSAR approaches the price action, thus allowing you to trigger the trend easily.

