Market corrections refer to a situation where stocks drop sharply after a major rally. In most cases, a correction is when the main indices like the Dow Jones and S&P 500 fall by about 20% from their top.
Some of the best-known market corrections are what happened during the dot com bubble in 2000, the Global Financial Crisis (GFC) of 2008, and in March 2020 when the World Health Organization (WHO) declared coronavirus a global pandemic.
Such corrections are usually difficult to predict. As such, traders and investors use several tools to predict when a major correction is about to come. In this article, we will look at some of the popular tools that will help you predict market corrections.
Fear and greed index
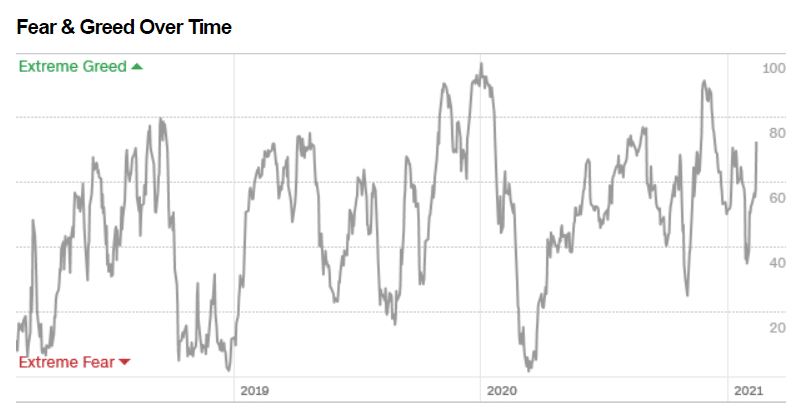
The fear and greed index is a tool that was developed by CNNMoney to provide a gauge of the current sentiment in the market. It uses several indicators and gauges to measure whether investors are fearful or greedy. In most cases, a market correction is usually preceded by a period of greed.
For example, before the 2000 crash, investors were buying any company with a dot com as a suffix. Similarly, before the GFC, investors were buying banking stocks because of their huge subprime mortgage businesses.
The fear and greed index is basically an aggregation of five key gauges that track the market.
- Market momentum – This gauge looks at whether the S&P 500 is above the 125-day moving average.
- Stock price breadth – This measure looks at the number of S&P 500 stocks that are rising versus those that are falling.
- Junk bond demand – ‘Junk bonds’ refers to those issued by companies with a weak credit rating. A high figure implies that investors have a strong appetite for risk.
- Stock price strength – This gauge looks at the number of stocks in the S&P 500 that are hitting their 52-week high and lows.
- Put and call options – This sub-index looks at the positioning of puts and calls in the options market.
- Market volatility – This tool looks at the CBOE VIX index, which is a well-known measure of volatility in the market. The VIX tends to rise in periods of high volatility.
- Safe-haven demand – This gauge looks at the overall demand for safe-haven assets like bonds. Precisely, it compares the overall performance of stocks vs. bonds in the past 20 days.
In general, the fear and greed index ranges between zero and 100. There is extreme fear when the index is between zero and 25. A figure between 25 and 50 is a sign that investors are getting fearful. Greed starts to emerge when the index is between 50 and 75, while any figure above that is a sign of extreme greed.
Most investors are usually comfortable buying stocks when the fear and greed index is in the greed zone. They then start selling when it moves to the extreme greed zone. The chart below shows that the index was at the extreme greed zone before the 2020 crash. Also, note that it reached a multi-year low during this period and started rising. As it did that, the stock market was rallying.
Yield curve inversion
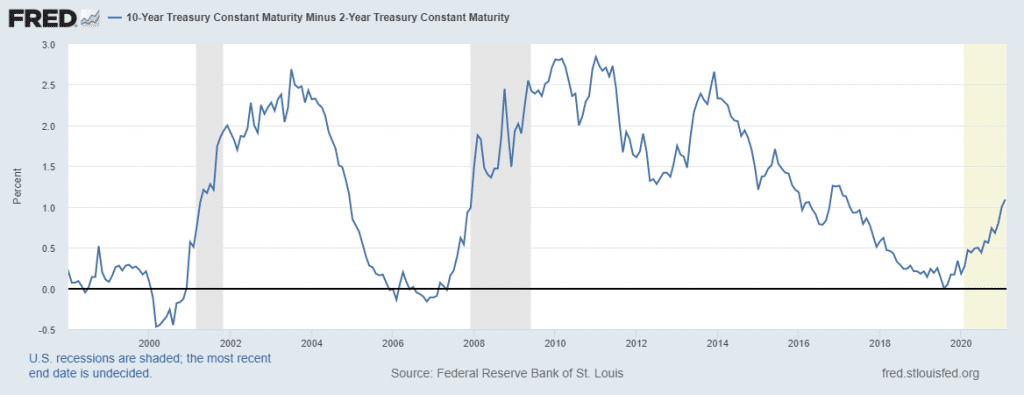
The yield curve refers to the difference between the yields of long-term bonds and their short-term counterparts. The most-used periods are ten years and two years.
In general, investors demand a higher yield for long-term bonds. Furthermore, it is difficult to predict what will happen in the next 30 years. They also demand a shorter-return for shorter-term government bonds. Therefore, in normal times, the difference between the longer-term and shorter-term yields is relatively straightforward.
A major sign of an impending market correction happens when there is a yield curve inversion. This happens when the short-term bonds have a better yield than the long-term ones. That is a sign that investors are relatively worried about the short-term outlook of the economy. In the past decades, a yield curve inversion has been followed by a major market correction, as shown below. Notice that the yield curve dropped below zero before the 2000, 2007, and 2020 crashes.
Buffett Indicator
Warren Buffett has one of the longest track records in the US stock market. His company, Berkshire Hathaway, is today the 11th biggest company in the world, valued at more than $568 billion. Therefore, while his star has faded recently, whenever he speaks, investors listen.
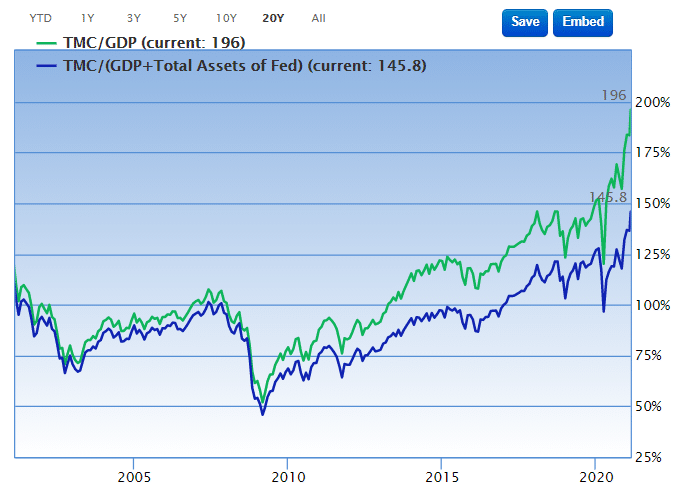
For decades, Warren Buffett has used the Wilshire Total Market indicator to predict when a correction is about to happen. This index is a relatively easy one to use. It basically looks at the total market cap of US equities and compares it with the total GDP of the United States.
Today, the US has a GDP of more than $23 trillion, while the total stock market is valued at more than $40 trillion. In fact, the five biggest American companies like Microsoft, Apple, Amazon, Alphabet, and Facebook are worth more than $8 trillion.
Therefore, the theory states that the higher the Buffett indicator is, the higher the probability of a correction. However, in the past decade, the actions of the Federal Reserve, including the low interest rates and quantitative easing have made this tool relatively ineffective.
Buffett indicator
Technical oscillators
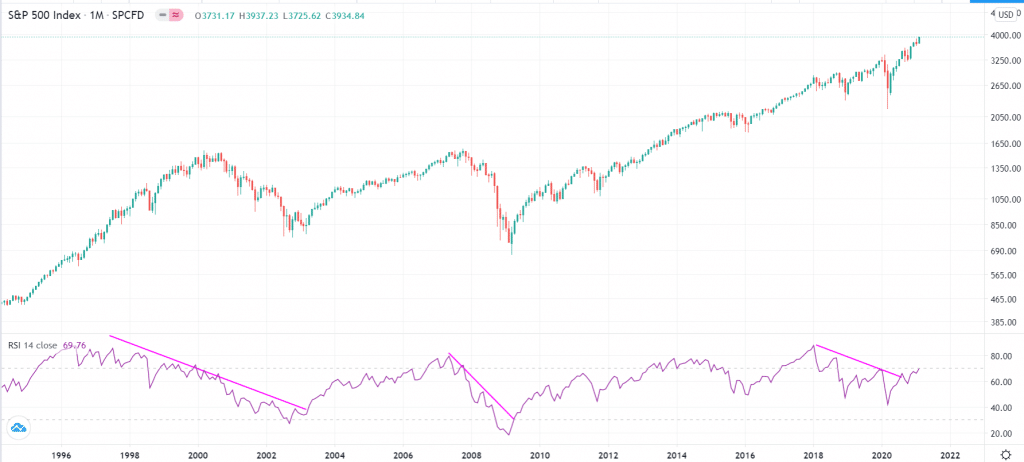
Investors use technical oscillators to predict when the next market correction will happen. Some of the most popular oscillators are the Relative Strength Index (RSI), Stochastics, and the MACD. Most of them are indicators of whether the stock market is overbought or oversold.
For example, the Relative Strength Index (RSI) measures the speed and change of price movements of a financial asset. The indicator oscillates between zero and 100. A figure above 70 is usually a sign that an asset is overbought, while a figure below 30 is a sign that the market is getting oversold. As shown below, major market corrections happen when the RSI moves above the overbought level. However, as shown, a correction can take weeks and months to happen after it crosses the overbought level of 70.
S&P 500 with the RSI
Summary
In this article, we have looked at some of the popular tools that can help you predict market corrections. In fact, we have looked at more than four. For example, in the fear and greed index, we looked at seven constituents of the index. Each of them is an important predictor of a crash on its own. Similarly, while we have looked at the RSI, we have also mentioned other indicators like the MACD and Stochastics.

