Trading indicators are tools that can help you examine the market by analyzing historical trends of the price action of assets. Coupled with a healthy combination of risk management and portfolio diversification, trading indicators can help you analyze the price movement with greater accuracy and precision.
Understanding the Indicators
Trading indicators are tools that you can apply to perform market analysis. They allow you to understand the historical trend of the price action and make accurate forecasts about expected future trends. Traders apply trading indicators to back their strategies with sound analysis for better decision-making and to alleviate unnecessary risks.
Let us now look at the top 5 indicators that you should consider using while trading.
Moving Averages (MA)
Widely used in trading, a moving average is an indicator that applies the asset’s prices to create a continuous trend. The MA filters and levels the price data for a particular time period, making it easier for traders to visualize trends. It can be used effectively to develop both short and long term trend analysis. Following are some aspects of the MA to be considered:
- The movement of the asset is assessed by the direction of the MA. An uptrend is represented by a rising MA line, while a downtrend is denoted by a falling MA line.
- The MA is an effective tool to examine an asset’s support and resistance levels. A lagging indicator, it relies on historical prices to develop trends.
- Simple, exponential, or linear are three methods to calculate the moving average. The simple and exponential MA’s are the most commonly used. While the simple moving average generates a simple MA line for a given data set, the exponential moving average uses weighted values to give more weight to newer price changes. Given below is the formula to calculate the moving average for a simple data set:

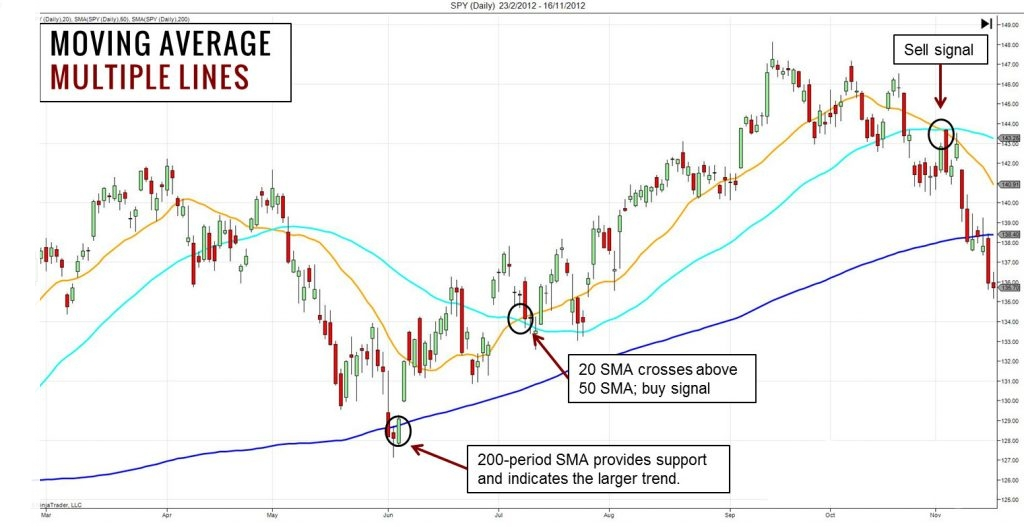
Here is an example of a simple MA for a trendline. Multiple MA’s are employed over successive periods of time to show major price changes. Observe how the 20-SMA eliminates irrelevant candlestick fluctuations to give a smoother trend in the graph above.
Stochastic Oscillator (SO)
The Stochastic Oscillator is a technical indicator that forms an analysis of the performance of a security based on its closing prices. Created by George Lane, it generates oversold or overbought signals for the prices of the asset by comparing the present closing price to a series of historical prices. The SO is a momentum indicator that registers price fluctuations within a range of 0 – 100, with values above 80 regarded as a signal for overbought assets while the values below 20 are considered as a signal for oversold assets.
When divergences occur in the stochastic oscillator, traders can develop signals for the reversal of trends. For instance, when the prices keep spiking, but the values of the oscillator keep declining, it can be regarded as a signal for a bearish reversal in trend.
The formula to calculate the Stochastic Oscillator is as follows:

where,
- C is the closing price.
- L14 is the lowest value registered of low price in a period of fourteen days.
- H14 is the record value registered of high price in fourteen days.
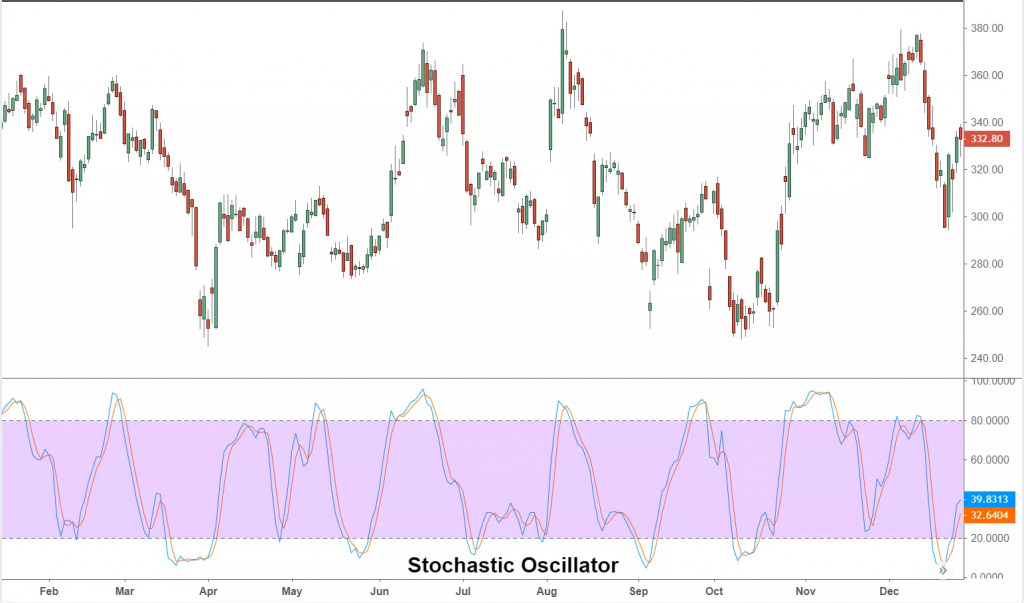
Here is an instance of a SO where it ranges from 0-100. 20 and 80 are taken as the oversold and overbought signal for the price of the asset. It is easy to observe the new levels of support and resistance using the SO.
Moving Average Convergence Divergence (MACD)
The MACD establishes the relation between two or more moving averages for a given asset. A market indicator, it checks the arrival of a new bullish or bearish trend. Convergence and divergence terms are applied to denote the meeting or moving apart of two moving averages, respectively.
The MACD comprises the following parts:
- The MACD line depicts how far the two means are different from each other.
- The signal line is a marker of the momentum of the change in price.
- Histogram depicts the values of the difference between the MACD line and the signal line.
MACD Line= 12 Period MA – 26 Period MA
The MACD line is created by marking the difference between the 12 period MA and the 26 Period MA. At the same time, the signal line is formed of the 9-period MA. When the MACD line cuts the signal line from below, it hints at buying, and if it crosses the signal line from above, it hints at selling.
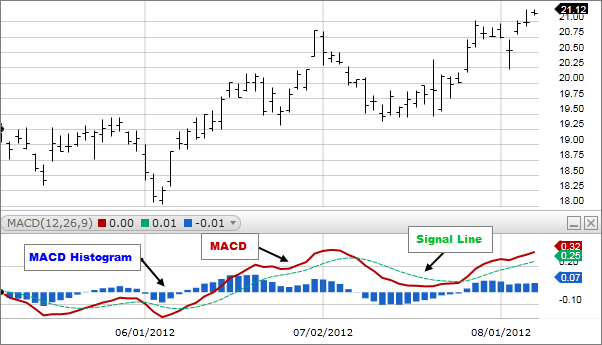
The graph depicts a typical MACD made of 12, 26, and 9 periods’ MA’s.
Bollinger bands
Bollinger bands are trading indicators that compute the volatility of the market using past prices. The prices are estimated with respect to previous high and low values. Bollinger Bands use standard deviation to analyze the fluctuation in the price of the asset. The standard deviation creates expansion or contraction in the bands. Wider bands denote a highly volatile market,Bollinger whereas narrower bands denote a less volatile market.
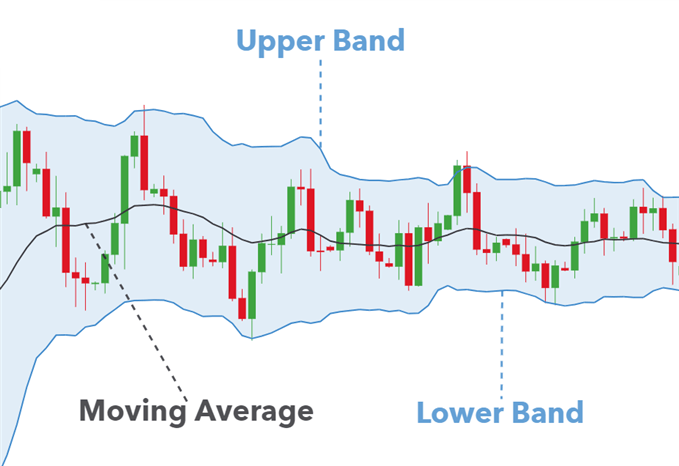
A typical bollinger band sequence.
A Bollinger Band is collectively made up of three bands — the upper and lower bands denote deviation from the middle band, which is made of a customizable, simple moving average. The 20-period is considered as the default time period for most charts; however, traders are free to customize this based on their trading objectives. Day traders tend to keep short periods for the middle line whereas investors with long-term objectives generally have longer moving-average periods.
Fibonacci Retracement
Before delving into Fibonacci retracement, you need to understand Fibonacci numbers. Fibonacci numbers are a set of numbers that are arranged in such a way that the previous two numbers sum up to form the next number, for example, 0, 1, 1, 2, 3, 5, and so on. These numbers have many interesting properties that also find their use in the trading universe.
When you divide a Fibonacci number by its predecessor, the result is always approximately 0.618. This is called the Golden Ratio. To form a Fibonacci retracement, find the highest value of high and the lowest value of low in the recent price fluctuations and develop the Fibonacci sequence for it. If the trough is at five and the peak is at 8, then 3 points will make it 100%. Now, you may run a Fibonacci retracement to develop various levels for this data set. You can draw lines at different ratios to estimate support and resistance levels for any trend.
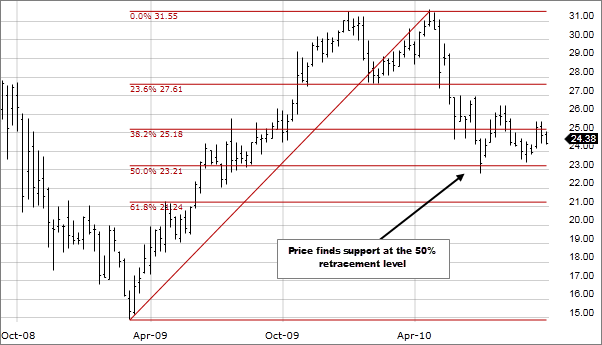
A Fibonacci retracement
Conclusion
You can use these indicators to analyze price trends and make forecasts about price behavior. It is easy to trade support and resistance levels with analytical tools. However, make sure not to use any indicator in isolation, as this may give you skewed results. Always use technical indicators in pairs to prevent inaccurate or weak signals when forming a trading strategy or making a decision.


