
A top to bottom forex trading approach is the process of analyzing currency pairs starting from the major macro issues to the tiniest details. In technical analysis, it refers to the process of analyzing charts from the longest durations to the shortest ones.

The goal of using the top to bottom approach is to have a good understanding of currency pairs and determining how they will move. In this article, we will look at this approach and how it can help you to become a better trader.
Top to bottom in fundamental analysis
Fundamental analysis refers to the process of using economic data and news to understand the current and future prices of a financial asset. Ideally, it helps you to get the intrinsic value of the asset.
In stocks, it is the process of finding the real value of a company. This can involve looking at price-to-earnings (PE), price-to-sales (PS), and enterprise value to earnings before interest, tax, depreciation, and amortization (EV to EBITDA). It can also include using mathematical calculations like the discounted free cash flow (DCF) and the adjusted present value (APV) in the analysis.
These valuation methods are not applicable in forex trading since you cannot assess the ideal value of a currency. However, in fundamental analysis, you can use other economic data to identify the future direction of a currency.
Interest rates in forex
In forex trading, interest rate states are the most closely-watched events because of their impacts on currencies. In fact, in fundamental analysis, forex traders are always trying to figure out whether any given event will lead to higher or lower interest rates.
In theory, higher interest rates usually lead to a higher currency value because it usually attracts more investments in the country. For example, if the Fed implements a 4% deposit facility rate while the European Central Bank (ECB) implements a 1% rate, many Europeans will move to the US in search of yields.
Therefore, in a top-down fundamental analysis in forex, you should always start with the recent actions by the central bank. Study and analyze what they did in their past meetings and assess what they could do in the following meetings. You should do this by reading their recent monetary policy statements and their recent speeches.
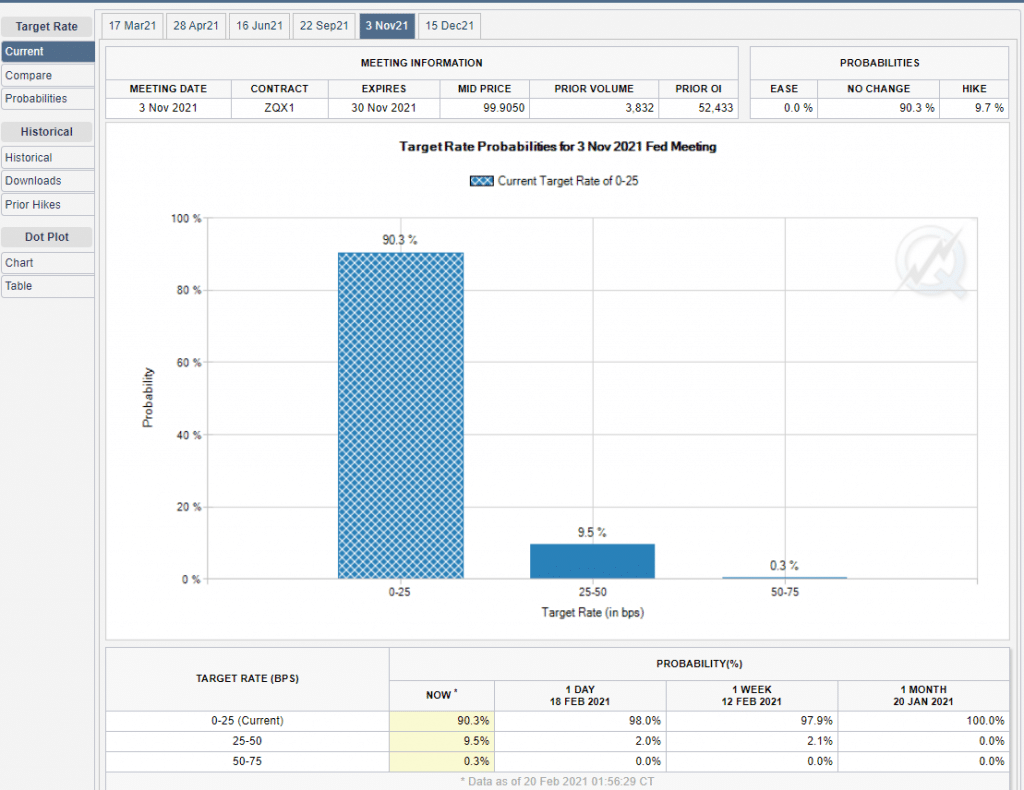
Further, you should use tools like the CME FedWatch to predict what analysts are expecting the bank to do. As shown below, most analysts expect the Fed to leave interest rates unchanged in their November meeting.
CME FedWatch tool
Use economic data
The next step in a top to down approach in forex trading is to use economic data to predict what the central bank will do. Some of the most important numbers you should focus on are:
- Consumer price index (CPI) – This is the most commonly used measure of consumer inflation. A higher number signals that the bank may hike rates.
- Producer price index (PPI) – This figure measures inflation in the corporate industry. A higher number signals possible rate hikes.
- Employment numbers – You should focus on the headline jobs data, unemployment rate, participation rate, and wages numbers.
- PMI – The manufacturing and services numbers are good indicators of the state of the economy. Higher numbers may be a sign of potential rate hikes.
- Confidence/sentiment – Consumer and corporate sentiment can be a sign of the health of the economy.
- Retail sales – The retail sector is the biggest employer in most countries. Strong numbers could be a signal of higher inflation and, thus, higher rates.
In addition to all these, you should study the ongoing political and geopolitical issues when analyzing currency pairs. In this, you should look at issues like elections and international relations. For example, in most cases, the value of the US dollar tends to rise when there are major global disagreements since investors usually rush to the US dollar.
Top to bottom in technical analysis
Technical analysis is the process of using indicators to predict the future price of a currency pair or any other asset. These indicators are classified into trends, oscillators, and volumes.
Some of the popular trend indicators are moving averages, Bollinger Bands, and the Ichimoku Kinko Hyo, while oscillators include the relative strength index (RSI), momentum, and the relative vigor index. Some of the popular volume indicators are the money flow index (MFI) and accumulation distribution.
The most recommended top to bottom analysis is to conduct what is known as a multi-time analysis. This is where you start your analysis by looking at a longer time frame chart and narrow it to the lowest. As you do this, your aim should be to identify long-term and shorter-term patterns.
These time frames tend to differ from trader to trader. For example, a scalper could start their analysis by looking at the four-hour chart, two-hour chart, hourly, 30-minute, and 5-minute chart. On the other hand, a swing trader holds positions for several days. As such, in their top to bottom analysis, they can start by looking at the daily chart, 12-hour chart, 5-hour, and hourly chart.
Doing this can help you understand the overall flow of a chart. It can also help you identify potential areas of support and resistance. For example, below is a daily chart of the EUR/USD pair identifying key resistance and support levels. Also, the chart shows that the pair has formed an inverse head and shoulders pattern.
EUR/USD pair daily chart
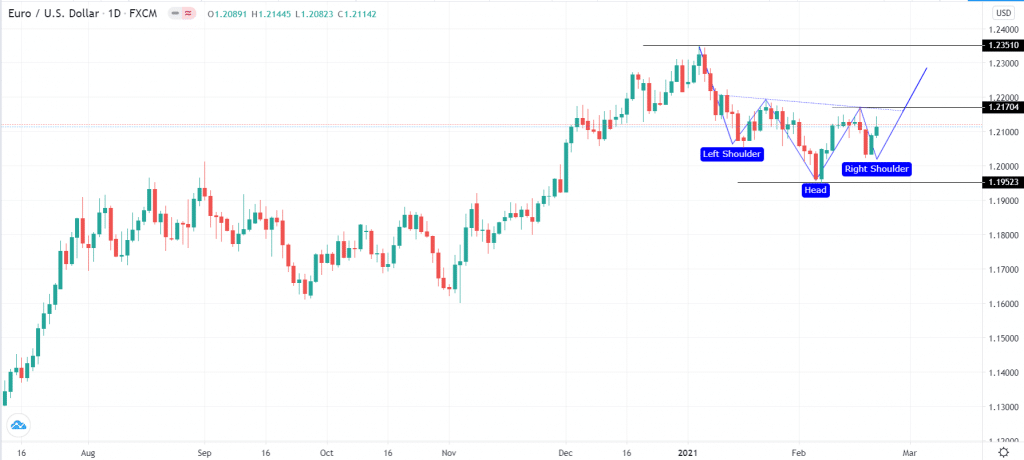
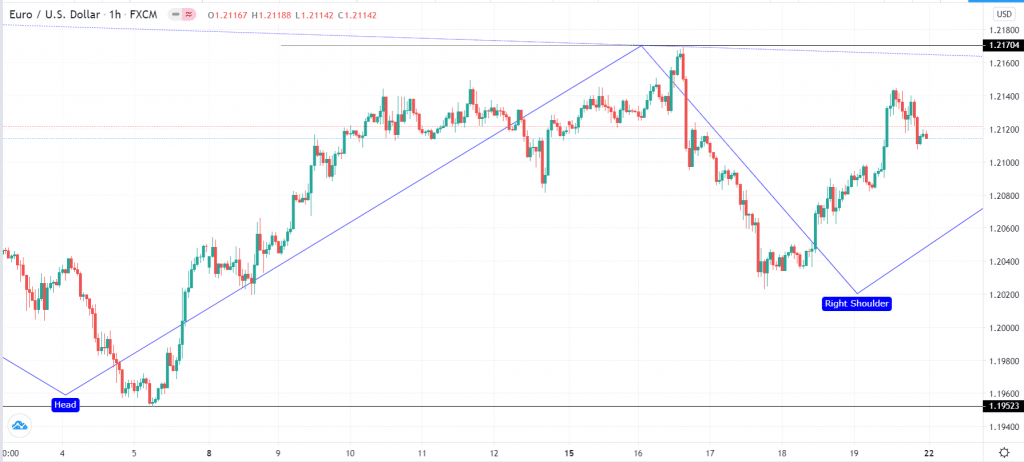
The next chart shows the key support and resistance levels shown above in the hourly chart. Therefore, looking at a longer chart can give you more details about the overall trend.
EUR/USD hourly chart
Summary
A top to bottom analysis is a strategy that most experienced professionals use. While the process might seem long, as you get used to it, you will find it relatively easy. For one, if you are a full-time trader, you will always have the overall picture of what is happening. You will not need to go through all these steps.

