Trading currency in the foreign exchange (Forex) market is a skill. There has never been a time when this skill was more important than it is today because of the unprecedentedly great interest in the market. Moreover, like any other skill, there are tools that one must learn to use to make them complete. A skilled angler not only knows how to set up the hook but also where to place the hook for the best catch!

Forex trading is broad and many tools exist with which you can set up profitable trades. Forex charting tools, however, are among the most important tools for identifying market entry and exit points. Such tools enable you to visualize the goings-on in the market of interest. Once you can see that a certain currency pair is developing a favorable trend, for example, you can easily spot a trading opportunity.
What are visual tools in forex trading?
Strategy wins the game. This mantra is relevant in forex as it is in the military. Great traders deploy the best strategies built with the best tools. In the forex market, visual tools enable formation of the best strategies because users can visualize future price movements. The best forex indicators are an example of great visual tools.
A forex indicator is a tool with which market technicians carry out technical analysis to come up with future price targets. In forex, technical analysis is price-biased and it is ideal for scalping. Scalpers are fast traders who are content with small but many profits within a short time. On the contrary, position trading exploits the long-term trend of a forex pair to lock in huge profits for periods up to years. Such market participants develop their strategies using fundamental analysis.
Forex indicators are the most popular visual tools
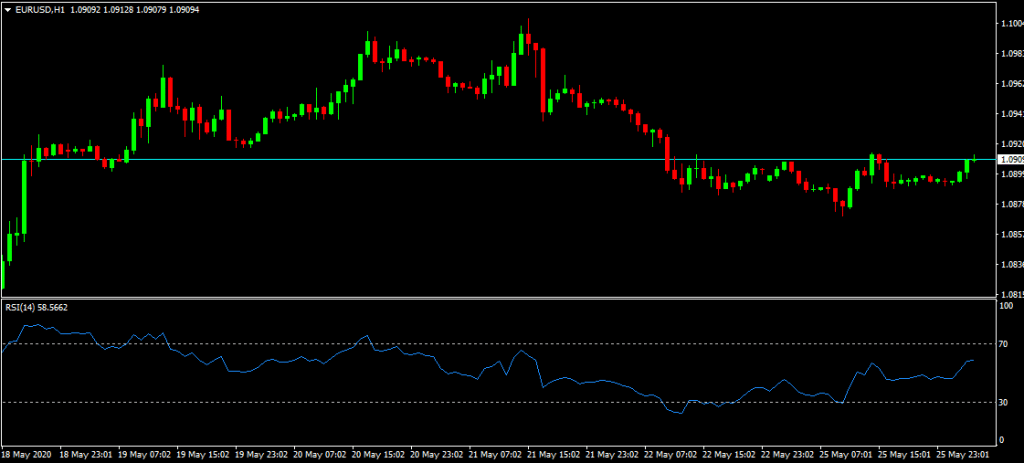
Each forex indicator has a place in the process of strategy development. For an oscillator, the purpose of the indicator is to enable you to measure the momentum of price in relation to market reversals, exhaustion, and trend extensions. The relative strength indicator (RSI), for example, measures the strength of the price actions as it evolves. RSI strategies prevent you from buying an overbought currency pair, or selling an oversold one.
The RSI uses a scale ranging from 0 to 100 to evaluate price. The gravitation of the RSI along the scale tells you two things; first, gravitating closer to 0 points to an oversold market, and the opposite points to an overbought market. Oversold conditions lie with the 0-30 band of the scale while overbought conditions lie in the 70-100-band. Secondly, the RSI tells you if the relative strength of the price action is going about to go bullish or bearish. In Figure 1 below, the market is undefined because the RSI index lies in the 30-70 band of the scale. In addition, the chart does not have a bias to either side.
Support and resistance indicators as visual tools
Besides oscillators, visual tools in forex trading help market technicians to identify support and resistance points in chart patterns. While oscillator indicators evaluate pricing momentum, support and resistance indicators define probable regions for profitable trade setups. Visual tools that define support and resistance levels are significant in confirming trades, whether it is time to enter or to exit the market.
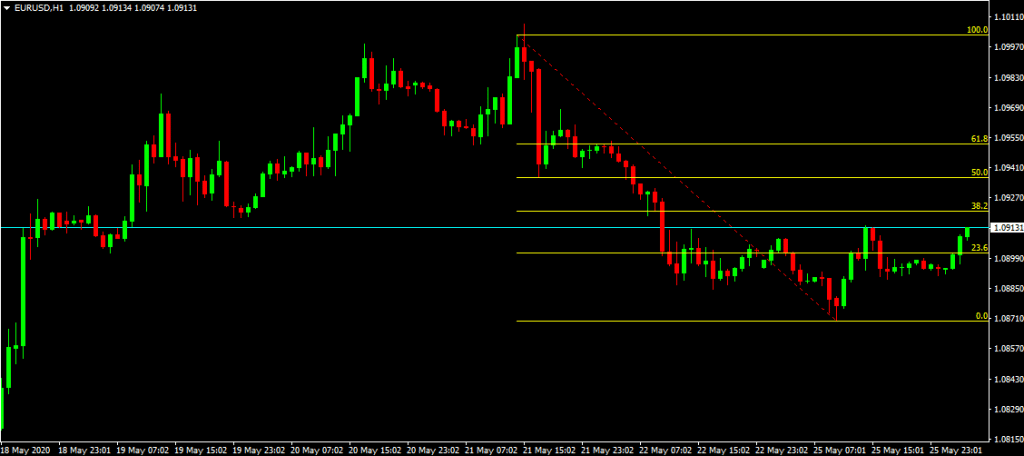
A good example of such a visual tool is Fibonacci retracement. Fibonacci retracement is an ideal indicator for trend trading. You can draw the Fibonacci retracement between two price points and the indicator will define different levels where the probability of resistance and support levels occurring is high. The retracement levels range between 0 and 100.
In Figure 2 below, the Fibonacci retracement is drawn between the highest and lowest price points in the last one week on the EUR USD price chart. The visual tool shows that the price action in the EURUSD market is likely to experience resistance at 38.2% Fibonacci retracement level. This is because the price action has failed to breach the level three times in a row.
Why should you know visual tools for forex trading?
Previously, we argued that forex trading is a skill where one is complete only if one can use appropriate tools to develop winning strategies. Of all forex trading secrets, this one is the most important. An angler will never draw fish if he/she cannot set up the hook and line properly. In addition, the angler must know the place where the probability of catching fish is high.
Visual tools are the hook and line for the forex market. The oscillator indicators will point you to the fish, and the support and resistance indicators will narrow down the most likely spot for a bumper harvest. Ultimately, visual tools are like night vision glasses in the thick darkness called forex. As we have seen, however, the night vision glasses are worthless if you do not wear them properly.

